In the previous installments of our series on native Apple applications, we looked at Pages on the iPhone. We gradually discussed working with text, images and tables, and in this part we will focus on creating and editing graphs.
It could be interest you

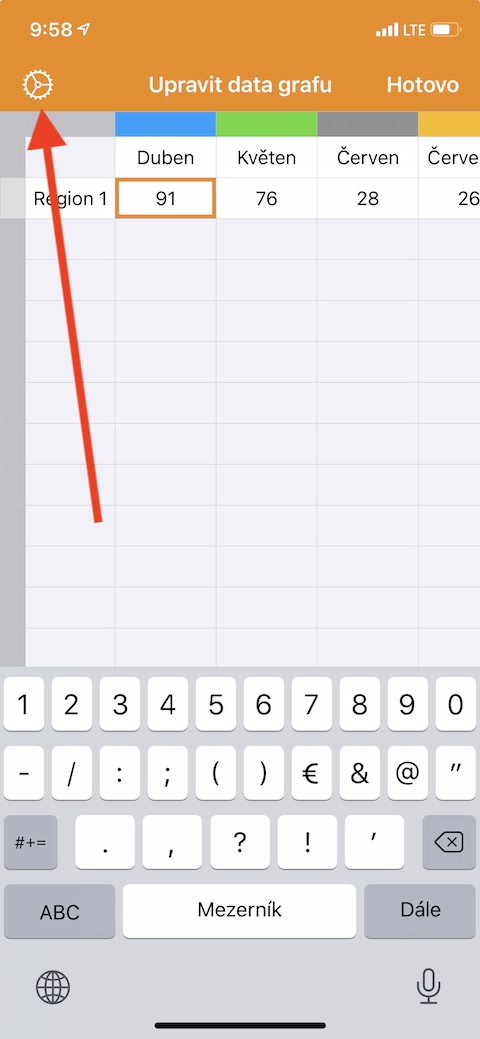
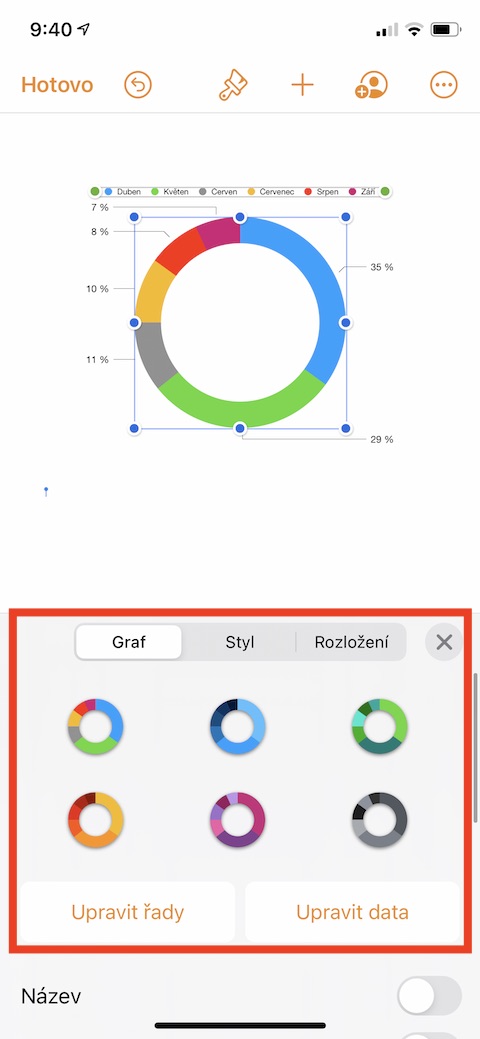
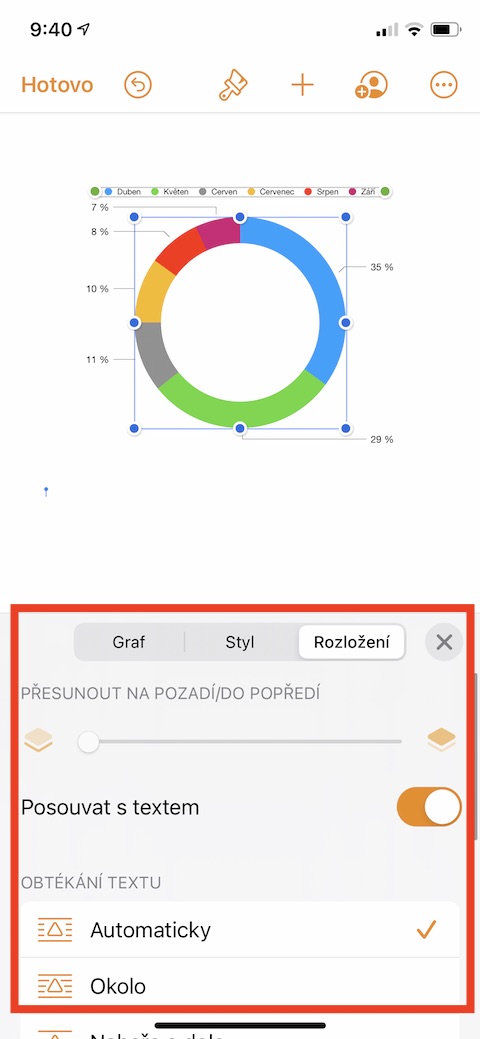
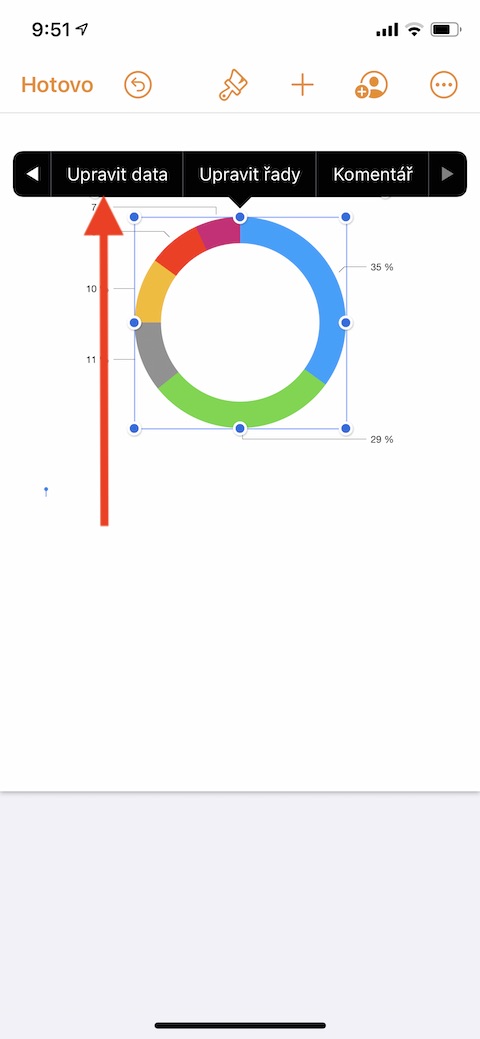
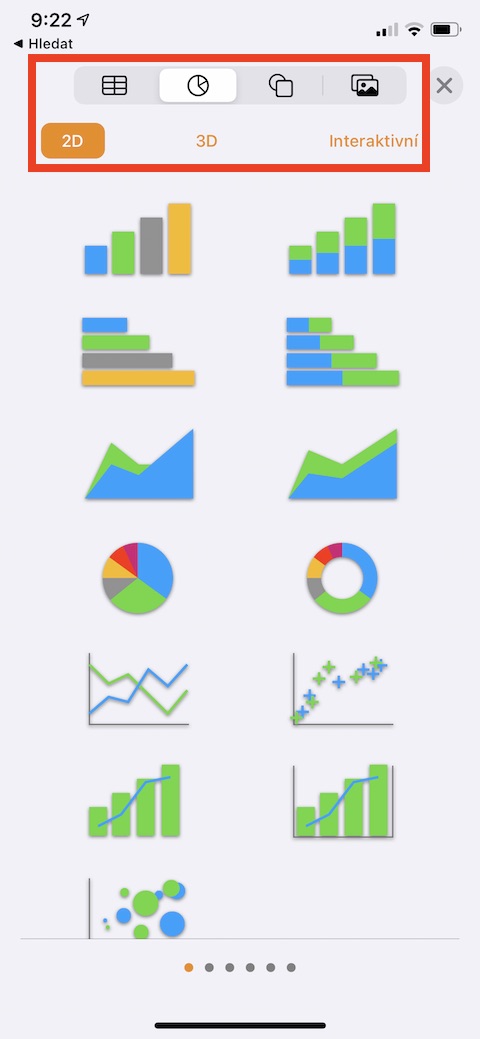
Creating graphs in Pages on iPhone is quite simple and intuitive, but the application also gives you a lot of options in this direction. Just like in Pages on Mac, you have 2D, 3D and interactive charts available. When creating a chart, you do not enter the relevant data directly into it, but into the chart data editor, in which you can also make changes - these will then be reflected in the chart by automatic updating. To add a chart, click the “+” button at the top of the screen, then click the chart icon. Select the type of chart you want to add (2D, 3D, or interactive) and then select a chart style from the menu. Click to select the chart you want and drag it to where you want it. To start editing a chart, tap to select it, then tap the brush icon in the panel at the top of the display. To add data, click on the chart, select Edit data and enter the necessary data, when the changes are complete, click Done in the upper right corner. To change how rows or columns are plotted as data series, click the gear icon on the toolbar, then select the option you want.
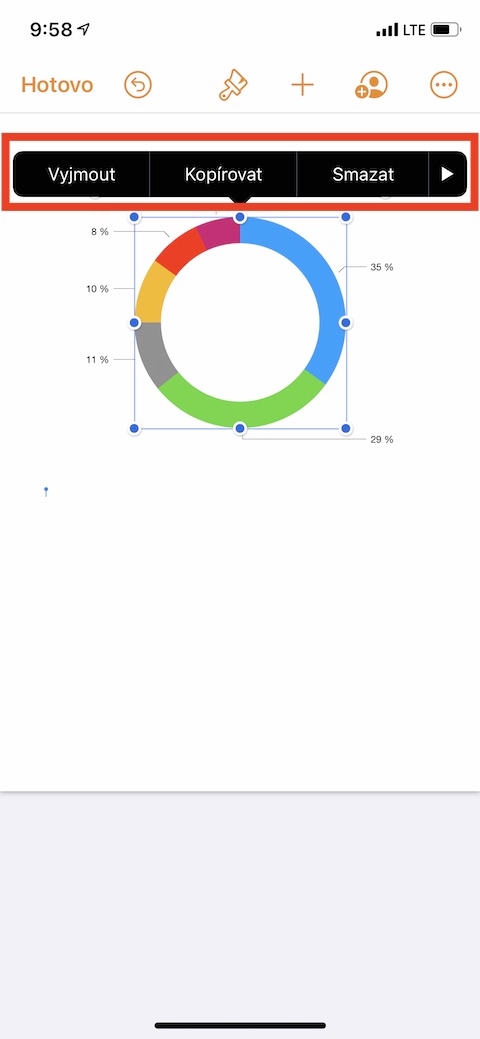
Of course, you can also copy, cut, paste and delete charts in Pages on iPhone – just tap on the chart and select the appropriate option in the menu bar. If you choose to delete the chart, it will not affect the table data. If, on the other hand, you delete the data of the table on the basis of which the chart was created, the chart itself is not deleted, but only the relevant data.
