In the previous parts of our series, dedicated to native Apple applications, we gradually introduced the basics of working in Numbers on the iPhone. Specifically, we looked at, for example, working with tables and inserting graphs. We will deal with graphs in this part as well - we will deal with data editing of graphs.
It could be interest you

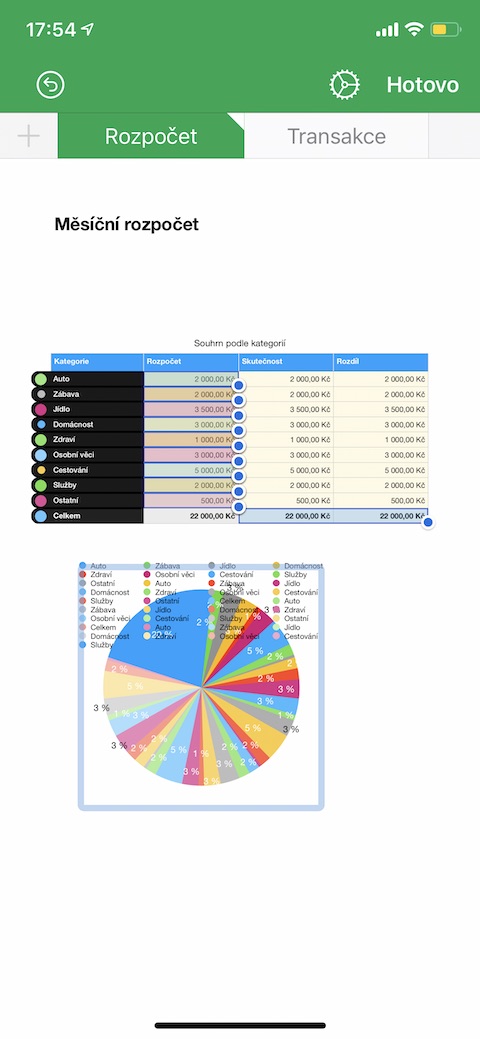
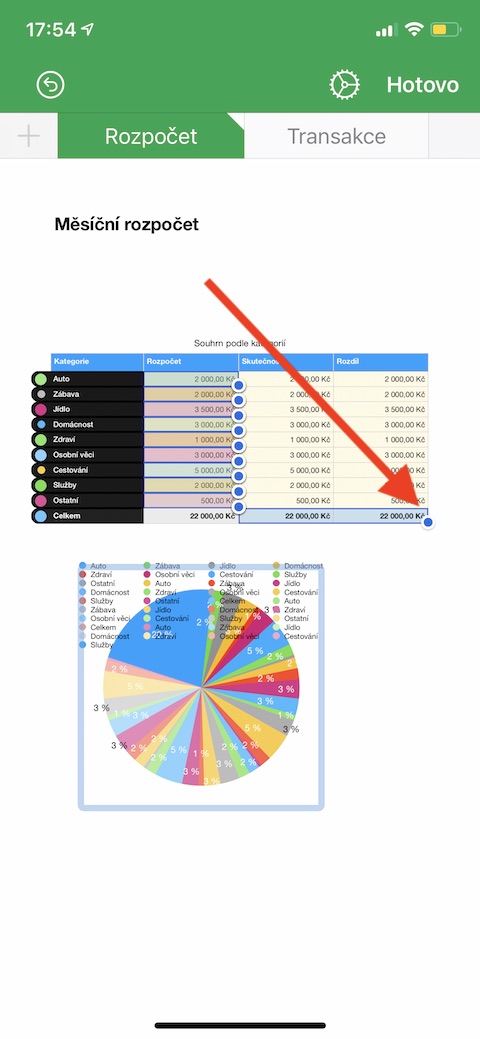
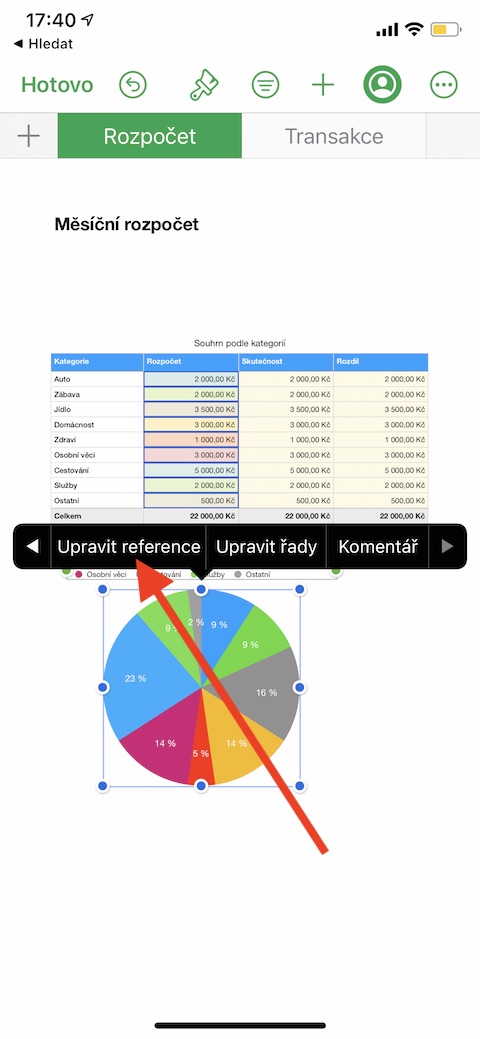
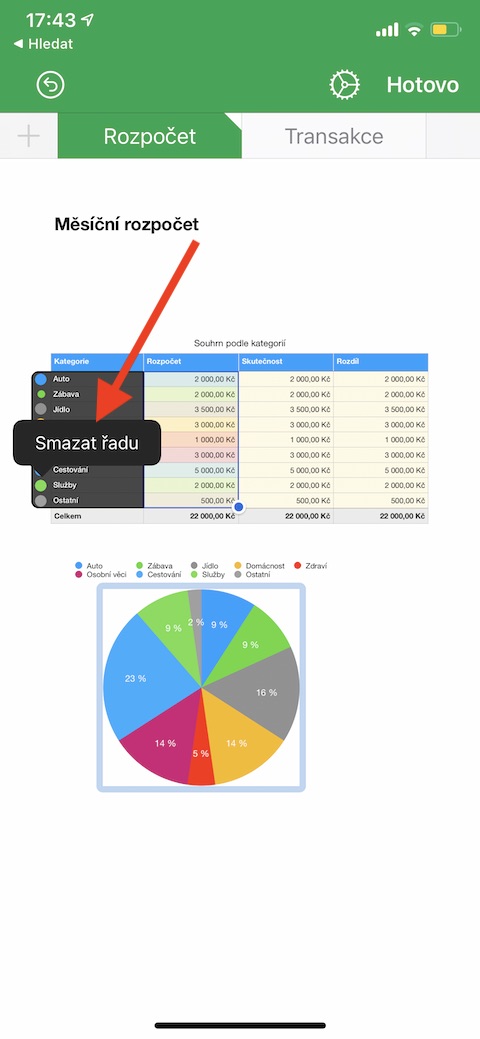
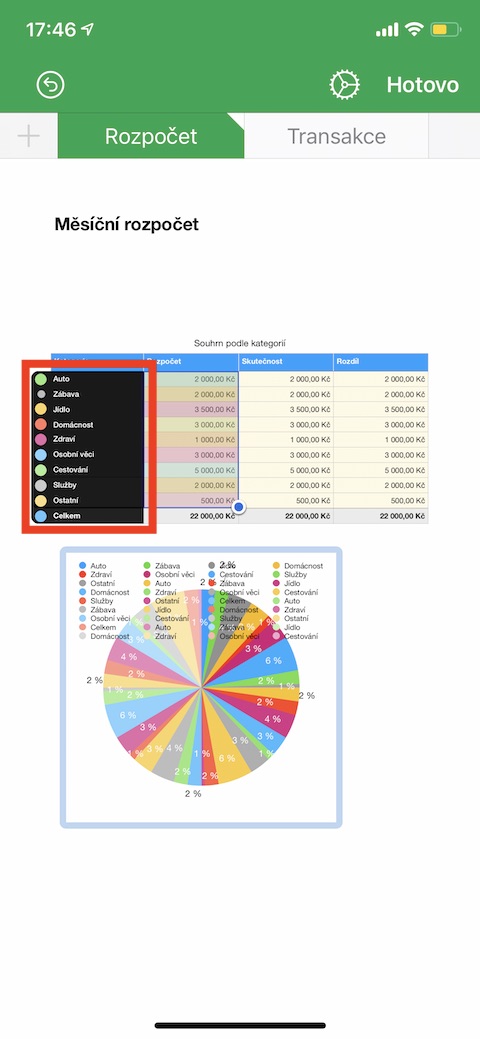
There are different ways to work with chart data in Numbers on iPhone. You can edit links to chart data, add or remove entire data series, or edit individual data series - add or delete data in them. When editing chart data, you may notice a white triangle in the upper right corner of the label on the sheets containing the data used in the chart. To add or delete a data series, click on the chart and select Edit references in the menu that appears. To delete a data series, click the colored circle next to the row or column you want to delete, then choose Delete Series. If, on the other hand, you want to add an entire row or column, click on its header cell. To add data from a range of cells, select the desired cells by pressing, holding and dragging. To add or delete data from an existing data series, click on the colored circle of a row or column and drag the blue dot in the corner of the selection over the required cells.
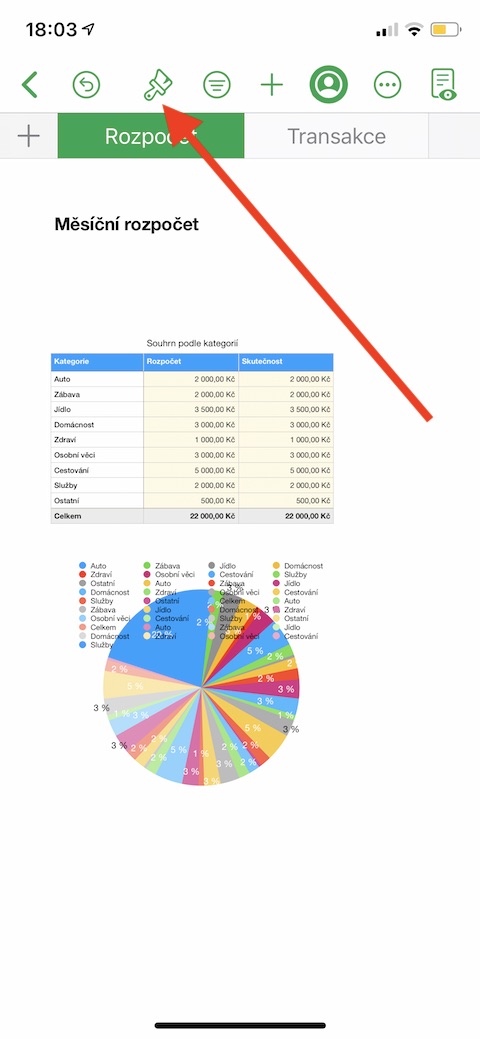
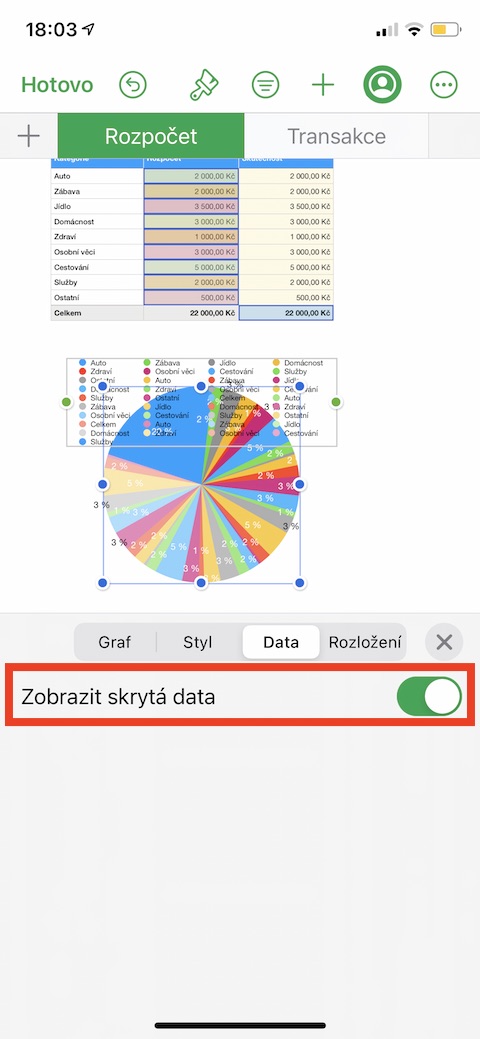
If you want to change the size of individual data series, click on the graph and select Edit references again in the menu. Then, in the panel at the top of your iPhone's display, tap the gear icon and choose Show All Rows. Finally, tap Done. Back on the chart page, drag the blue dots on the edges so that only the cells you want are in the selected rows. To return to the chart, click Done in the upper right corner. You can also work with tables with hidden data in Numbers on Mac. If you want to show this hidden data in a chart, first click on the chart and then click on the brush icon in the top panel. In the menu that appears at the bottom of the display, switch to Data and activate the Show hidden data option.
