In the previous installment of our series on Apple's native apps, we looked at Numbers on the iPhone — specifically focusing on spreadsheets, editing, and data entry. In today's installment, we'll take a closer look at the basics of working with charts—specifically, how to add data to a chart in Numbers on iPhone, how to choose a chart style, and how to make basic adjustments.
It could be interest you

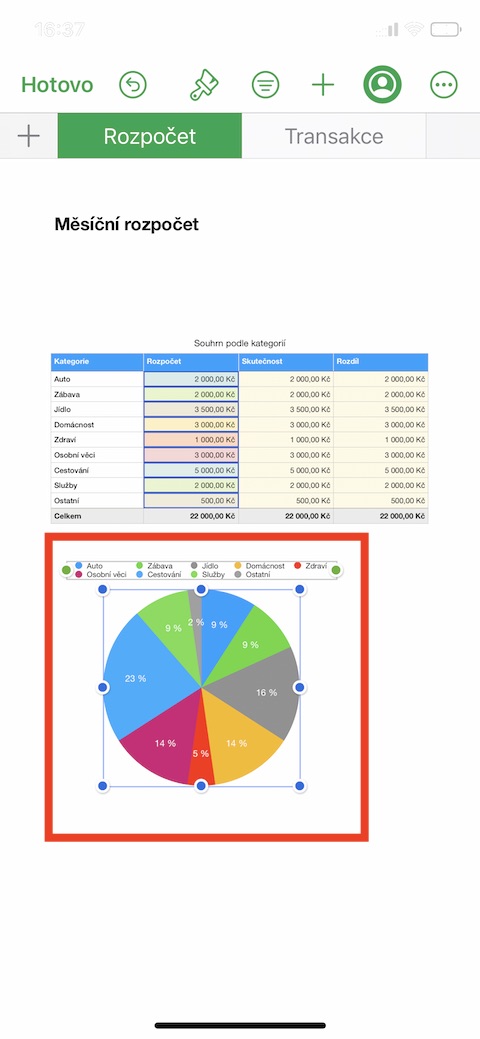
In addition to tables, you can also add and work with charts in the Numbers app on iPhone. First, you will need to select the data from which you want to create the appropriate chart. Select the cells in the table that contain the given data. To add data from an entire row or column to the chart, click first on the table, and then on the number or letter of the row or column. After clicking on the selection, you will see a menu where you can click Actions with Cells -> Create New Chart.
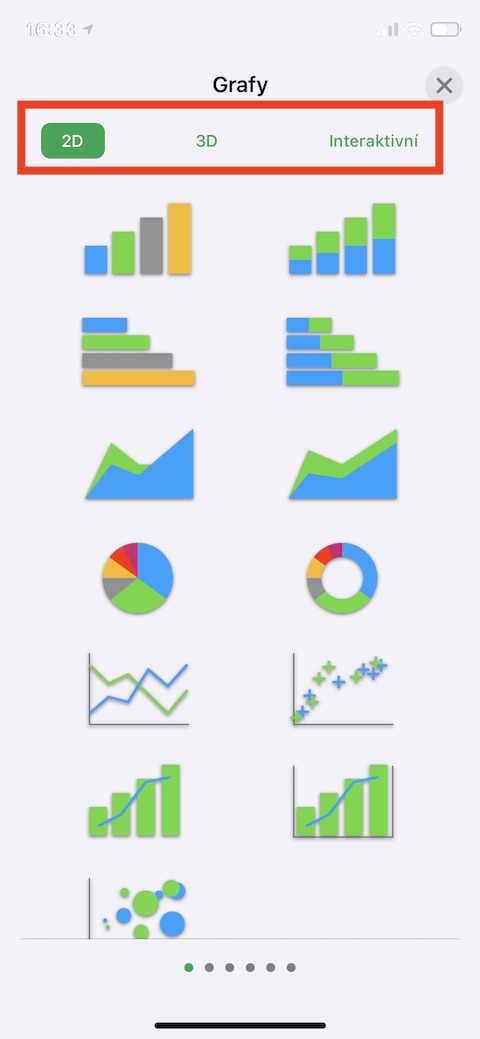
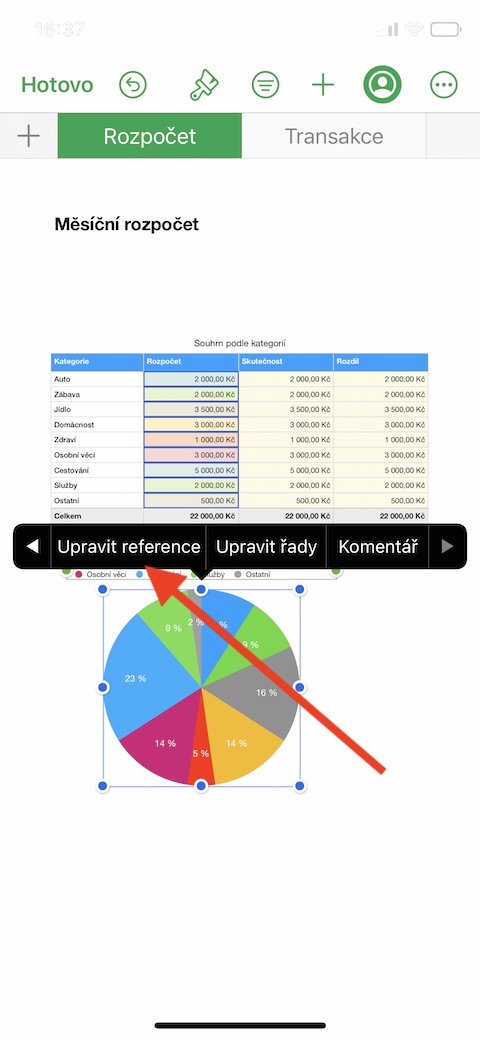
You will see a menu of graphs - on the panel at the top of the screen you will find an overview of the types of graphs (2D, 3D, Interactive), and below this panel you will find individual graph styles. Select the chart you want to work with and drag it to the desired location in the document. To set how the data series are plotted, click Graph -> Edit References, then click the gear icon at the top of the display to set the desired option. To finish editing, click Done in the upper right corner of the screen. If you want to immediately start creating a chart without using data from the tables, click on the "+" icon in the upper part of the display and then select the desired chart in the usual way.
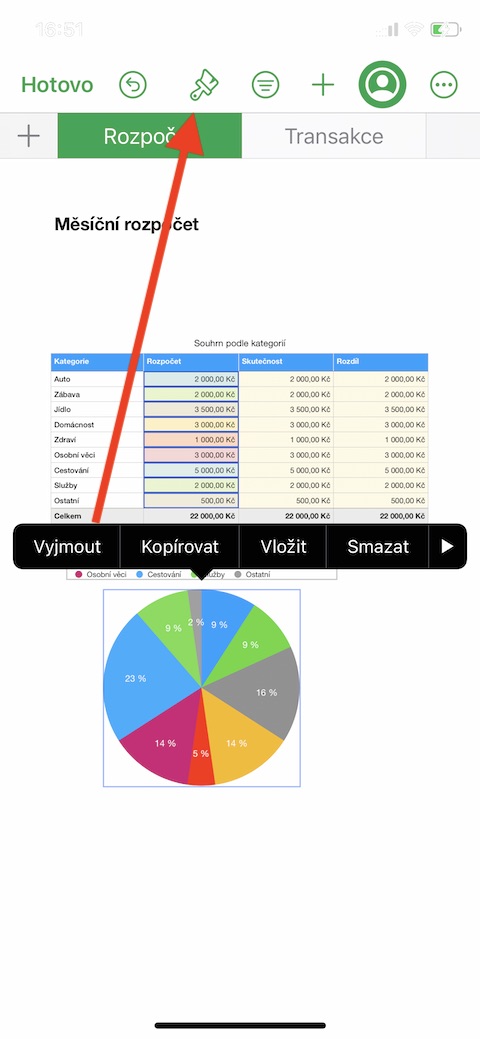
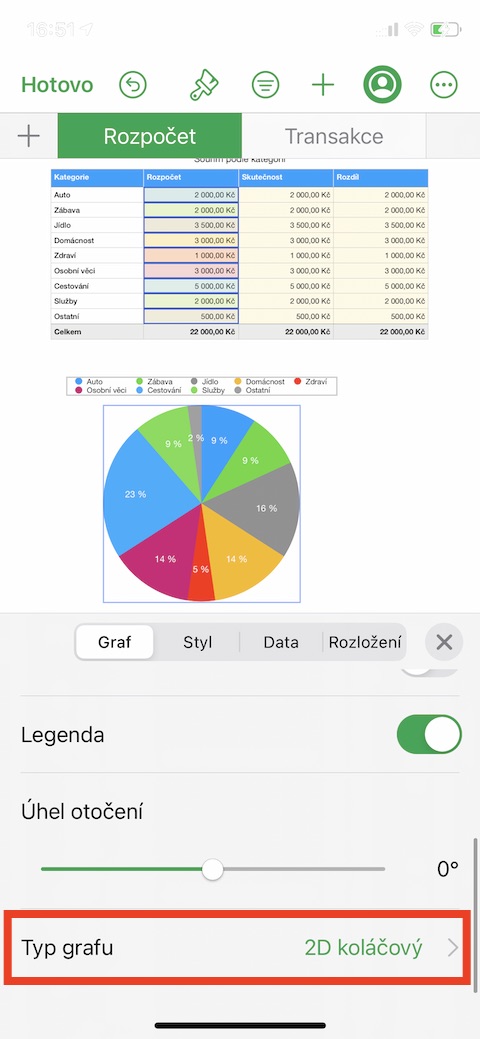
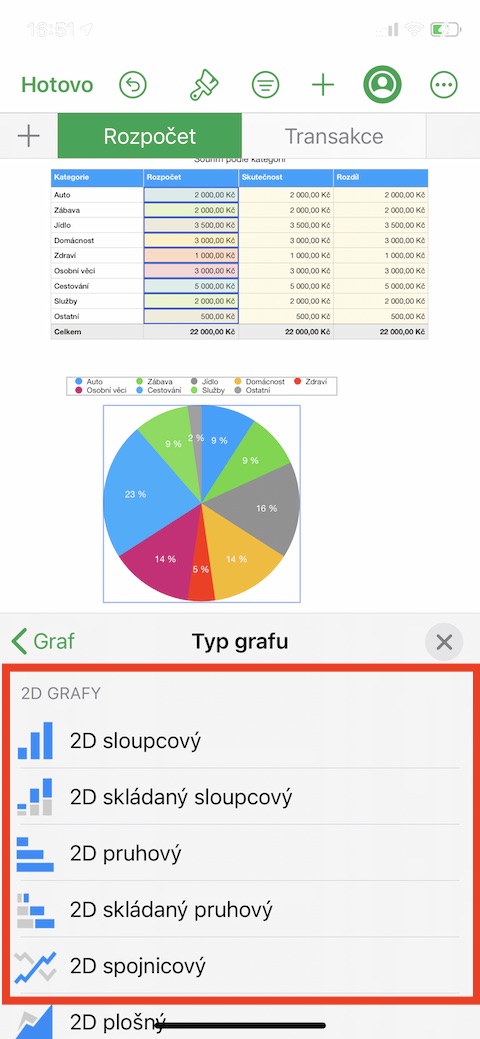
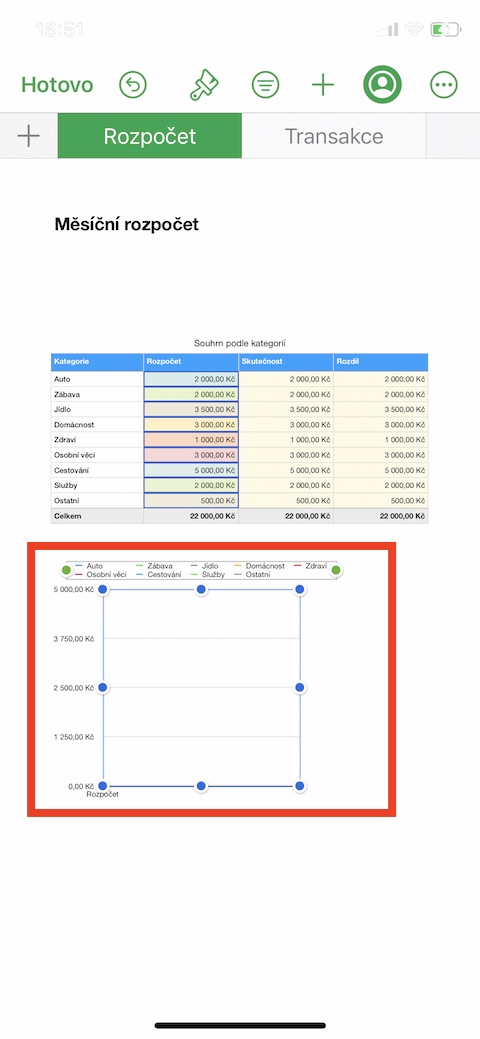
To change the chart type in Numbers, first tap to select the chart, then tap the brush icon at the top of the screen. Click Chart Type, then select the chart type you want. The change will happen automatically, the data will be preserved. To delete a chart in a Numbers document, simply click on it and choose Delete from the menu.
