Also this week, as part of our series on native Apple apps, we'll be looking at a utility called Activity Monitor. In the previous section, we discussed the basics of its control in more detail, today we will take a closer look at starting system diagnostics, terminating processes and checking RAM consumption.
It could be interest you
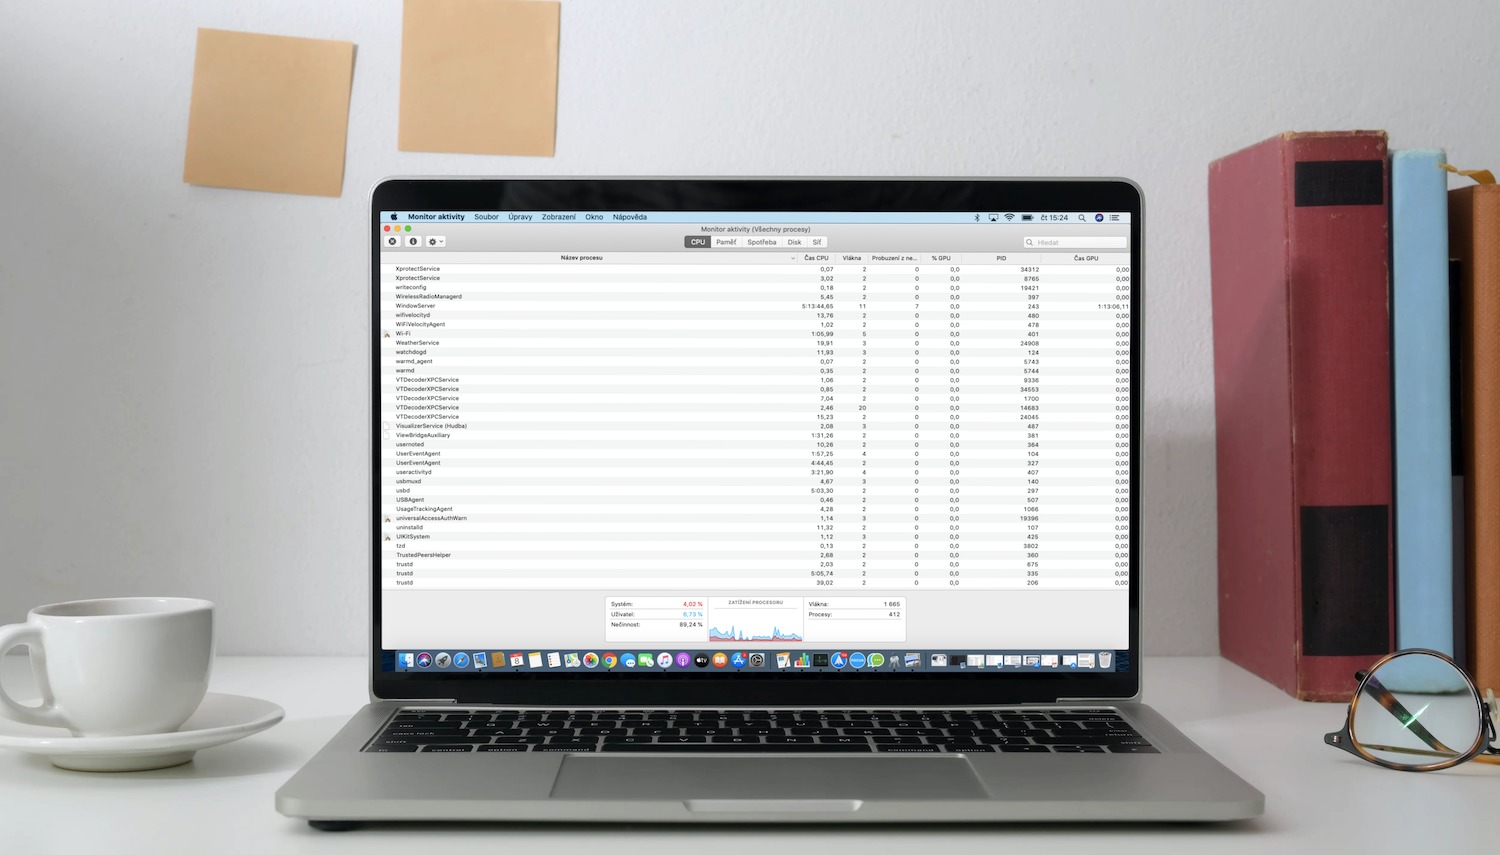
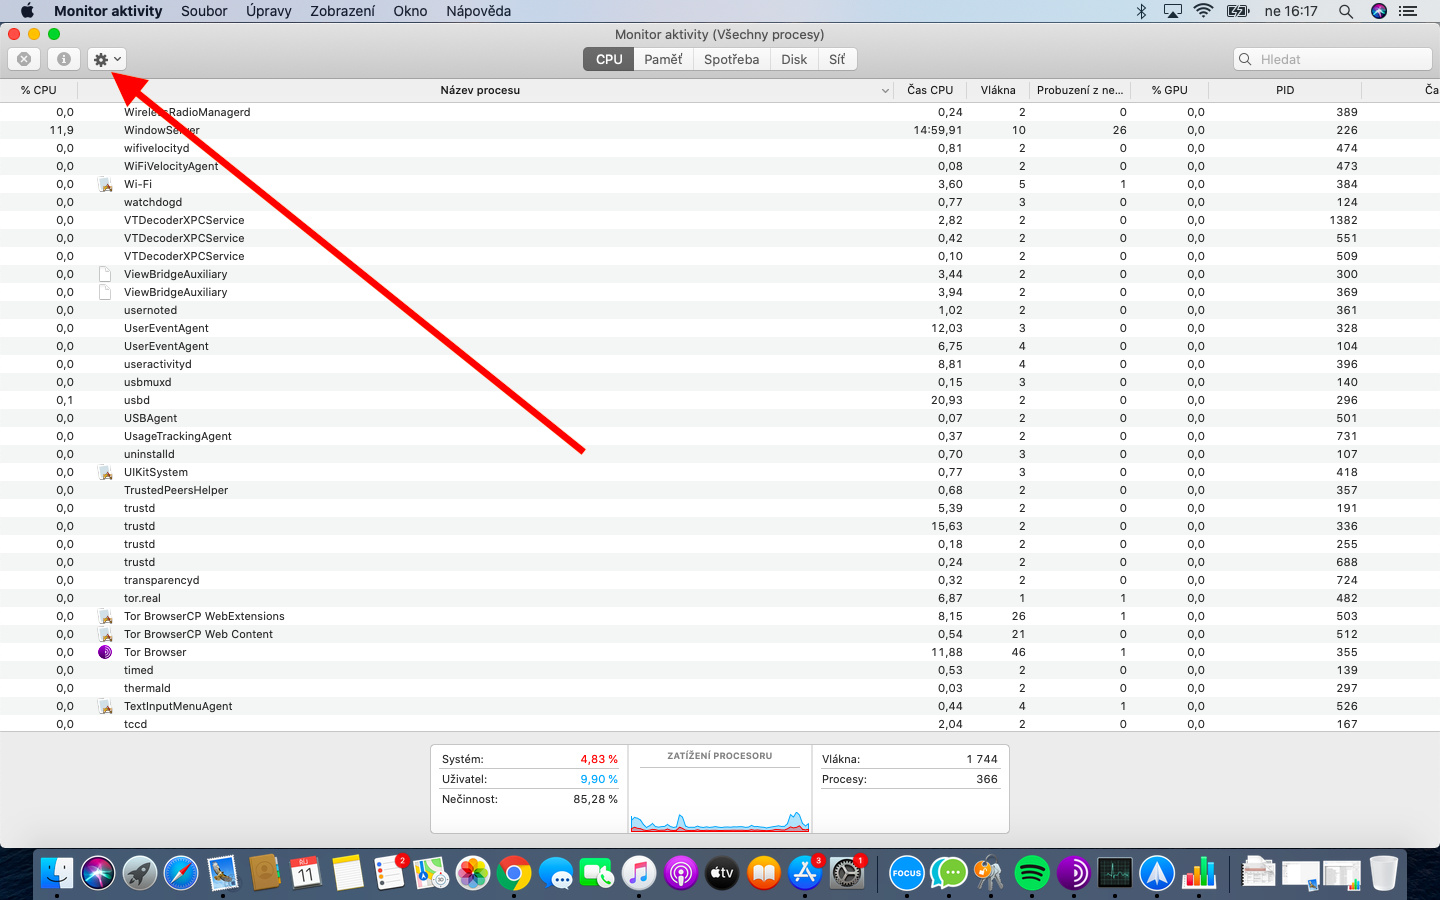
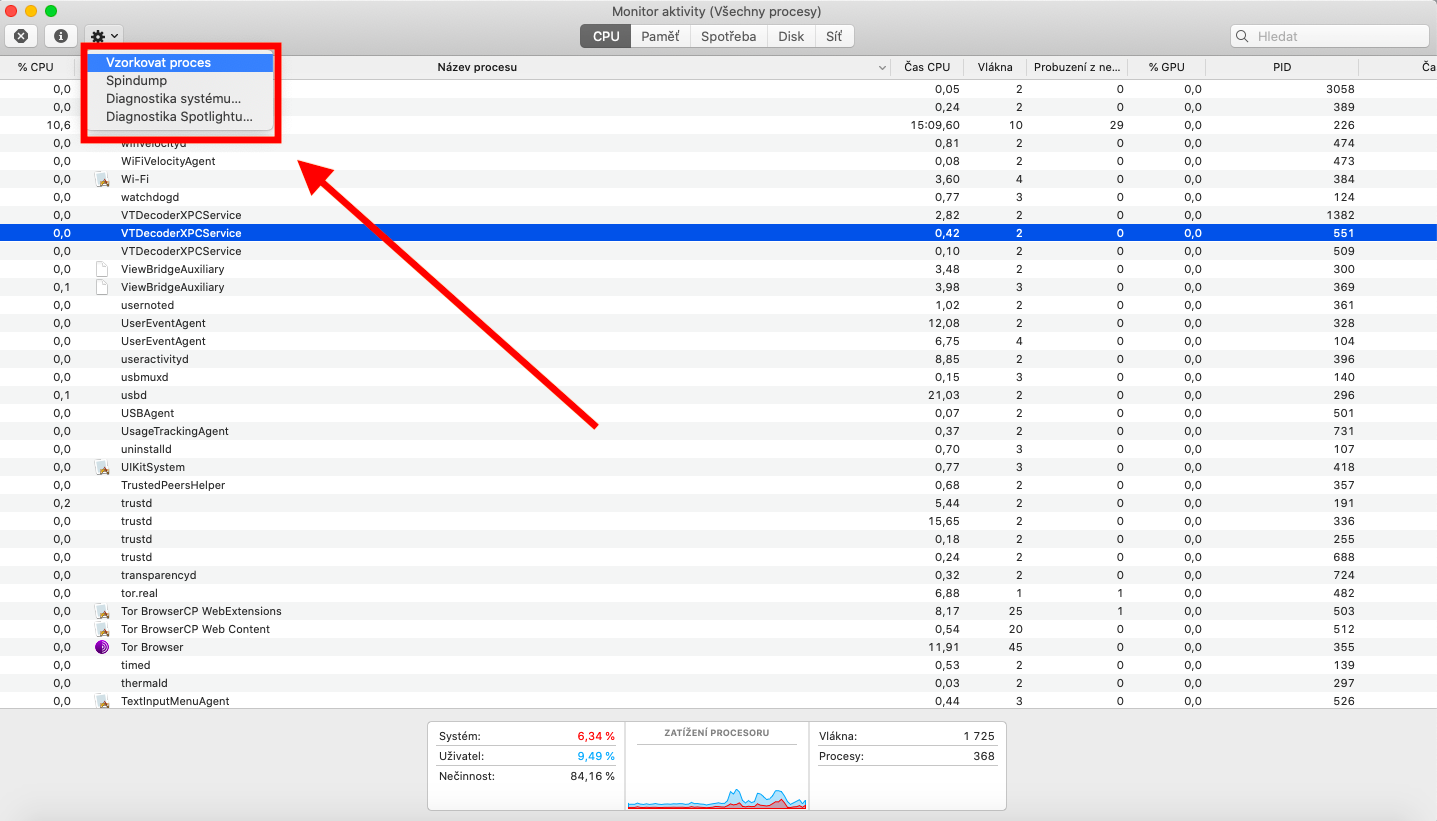
Among other things, the Activity Monitor utility on Mac can also be used to compile a system diagnostic report. After creating it, you can save it and send it to, for example, Apple support staff. Launch Activity Monitor and click the gear icon in the upper left corner of the application window. Select the process you want to execute - when you select Sample Process, the selected process will be reported to within 3 milliseconds. Spindump will create a report on unresponsive applications that have been forced to quit, System Diagnostics will create a report using various protocols on your Mac. Select Spotlight Diagnostics to create a report on all processes running on your Mac.
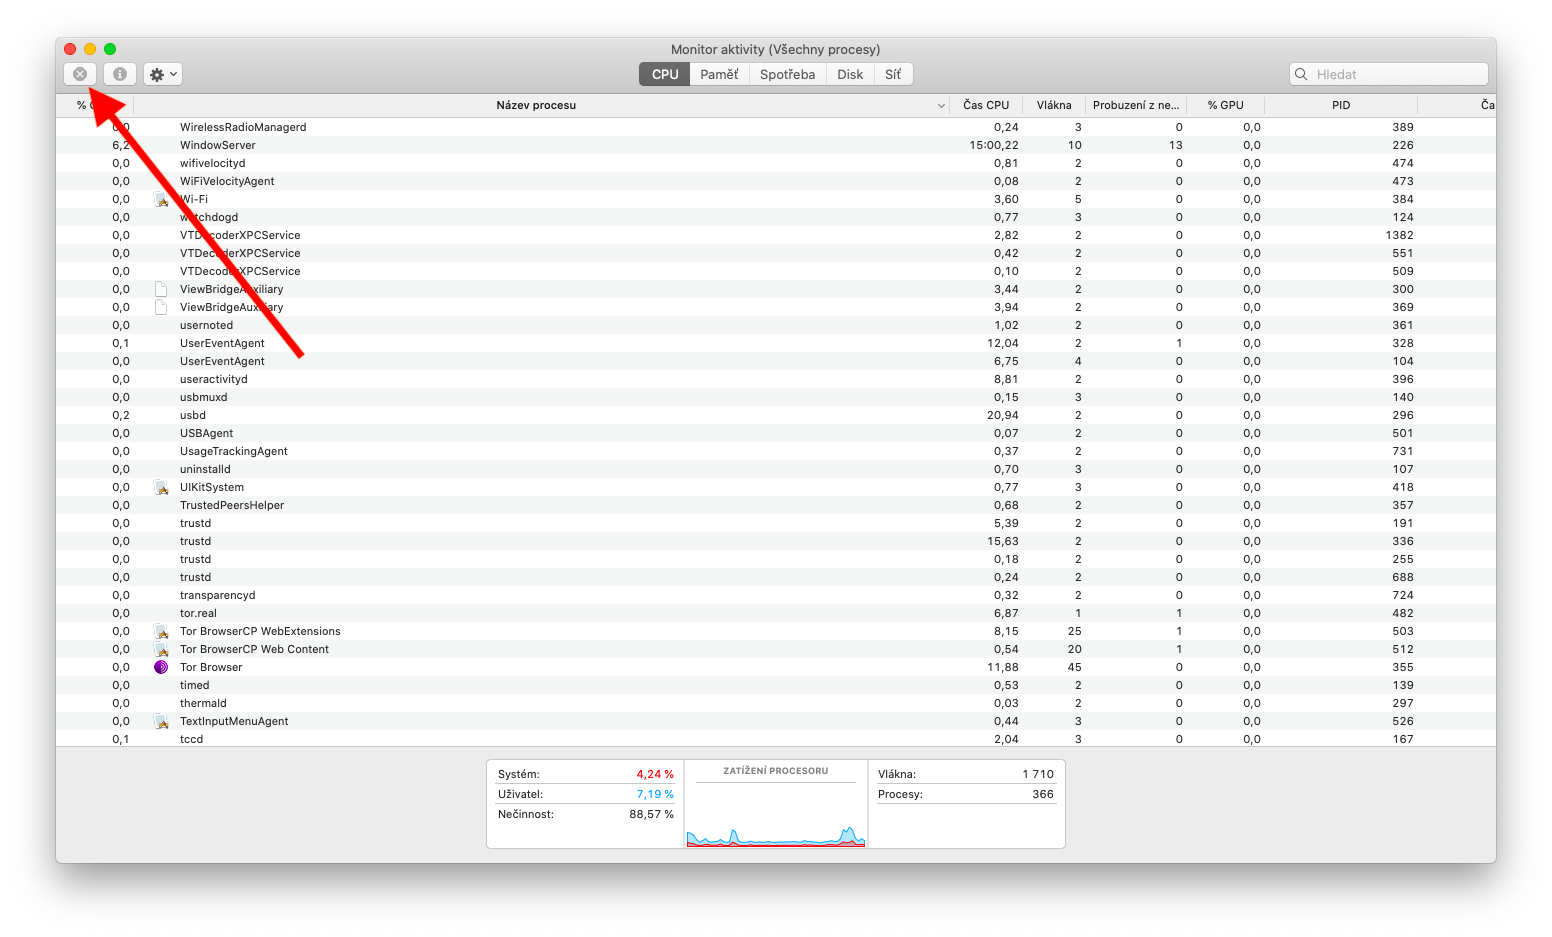
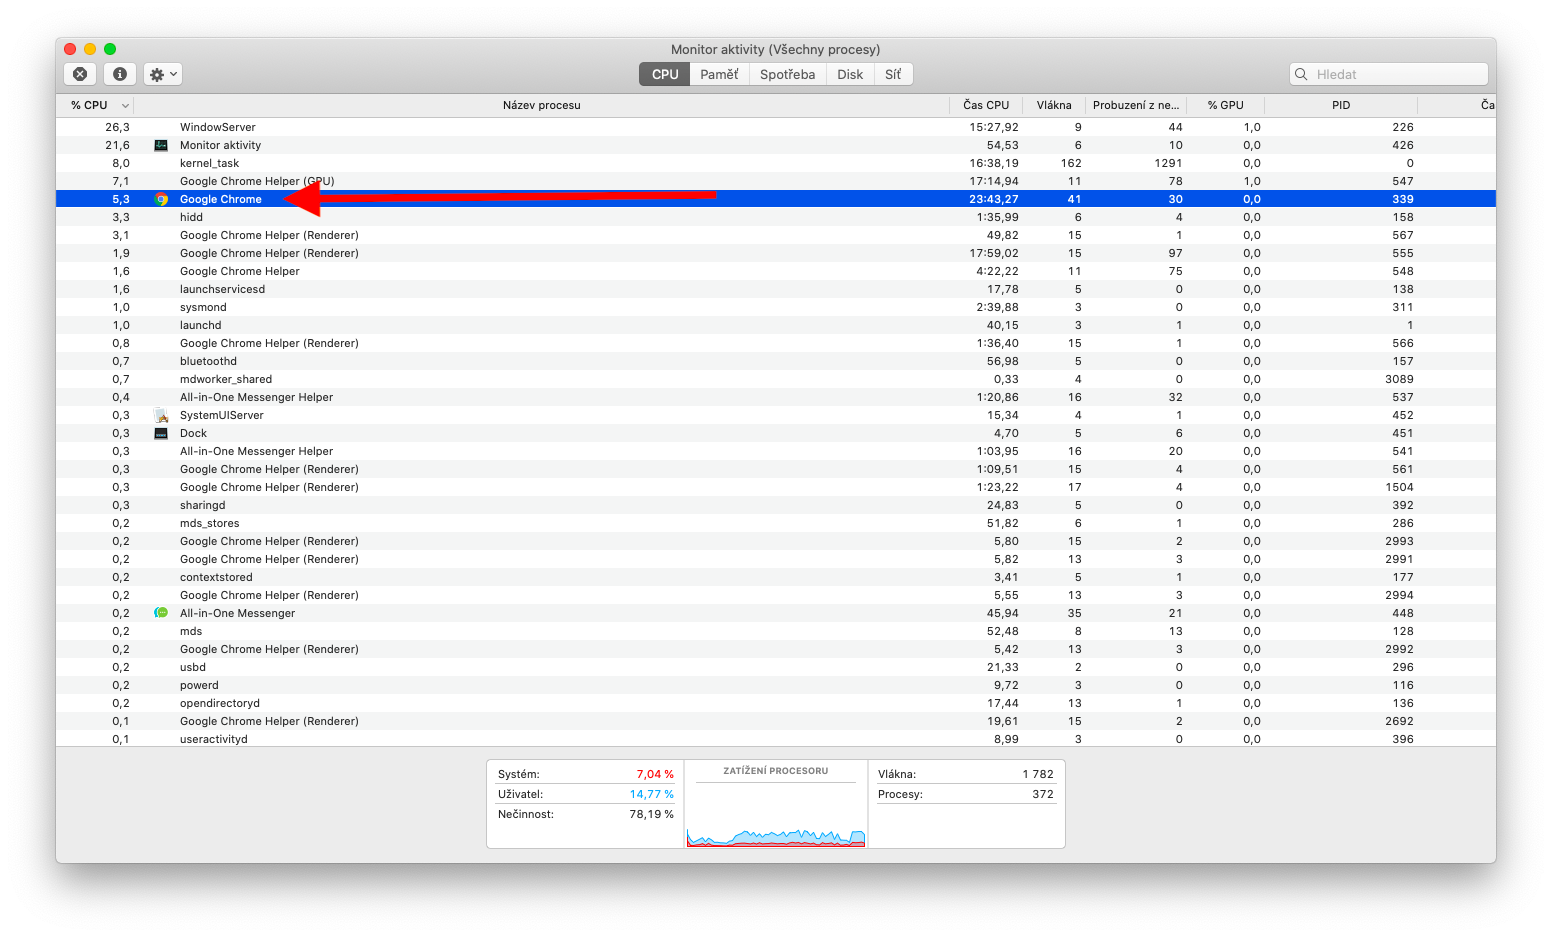
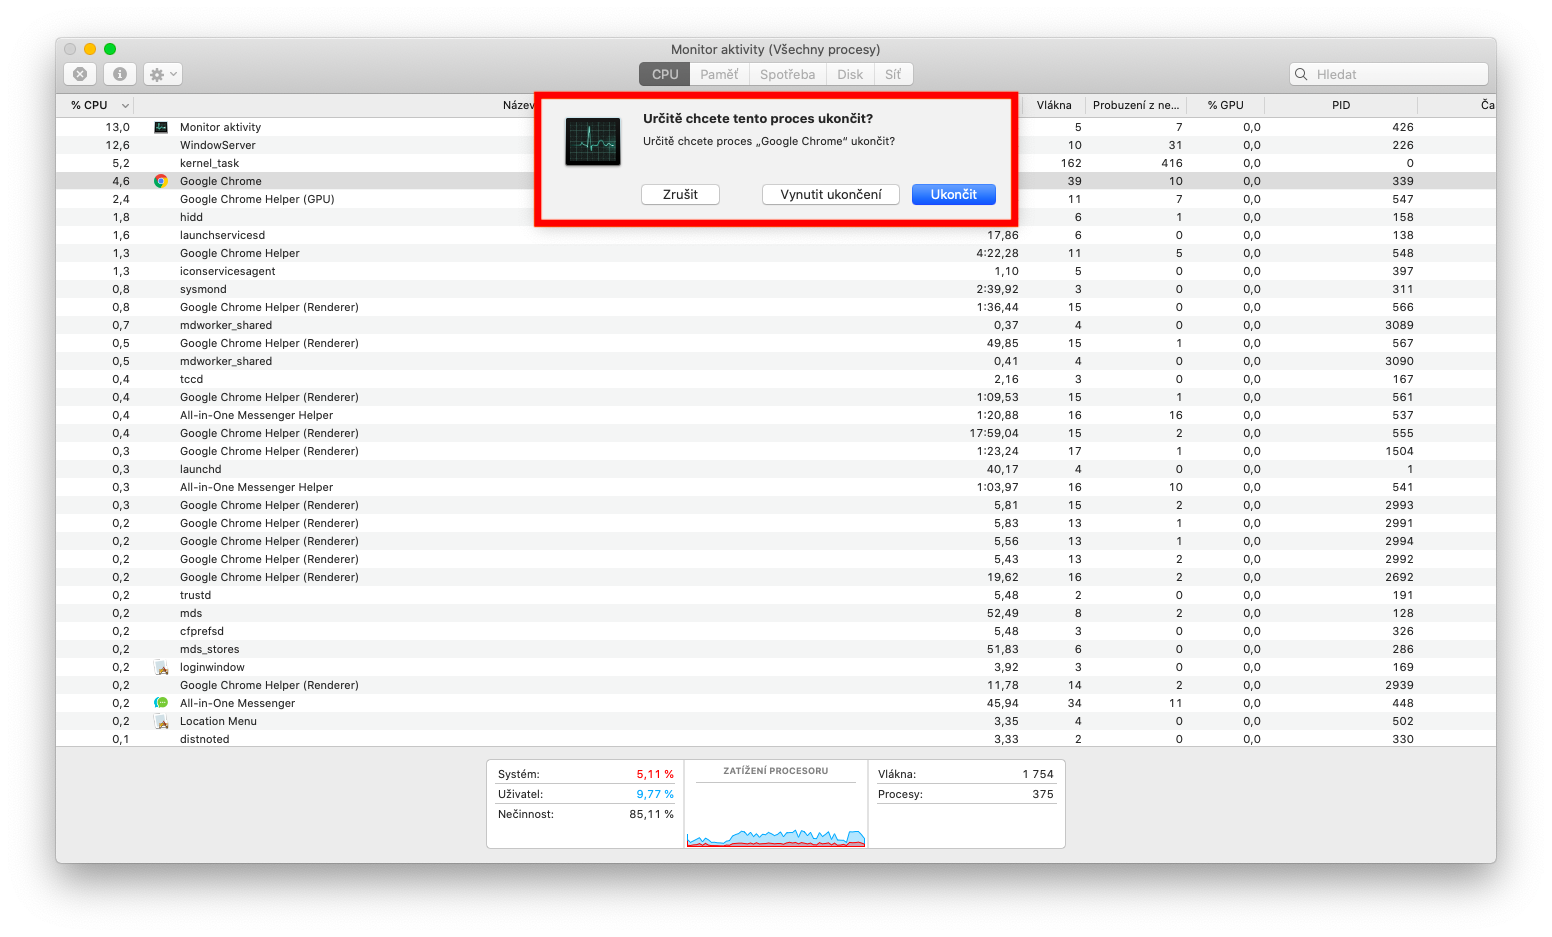
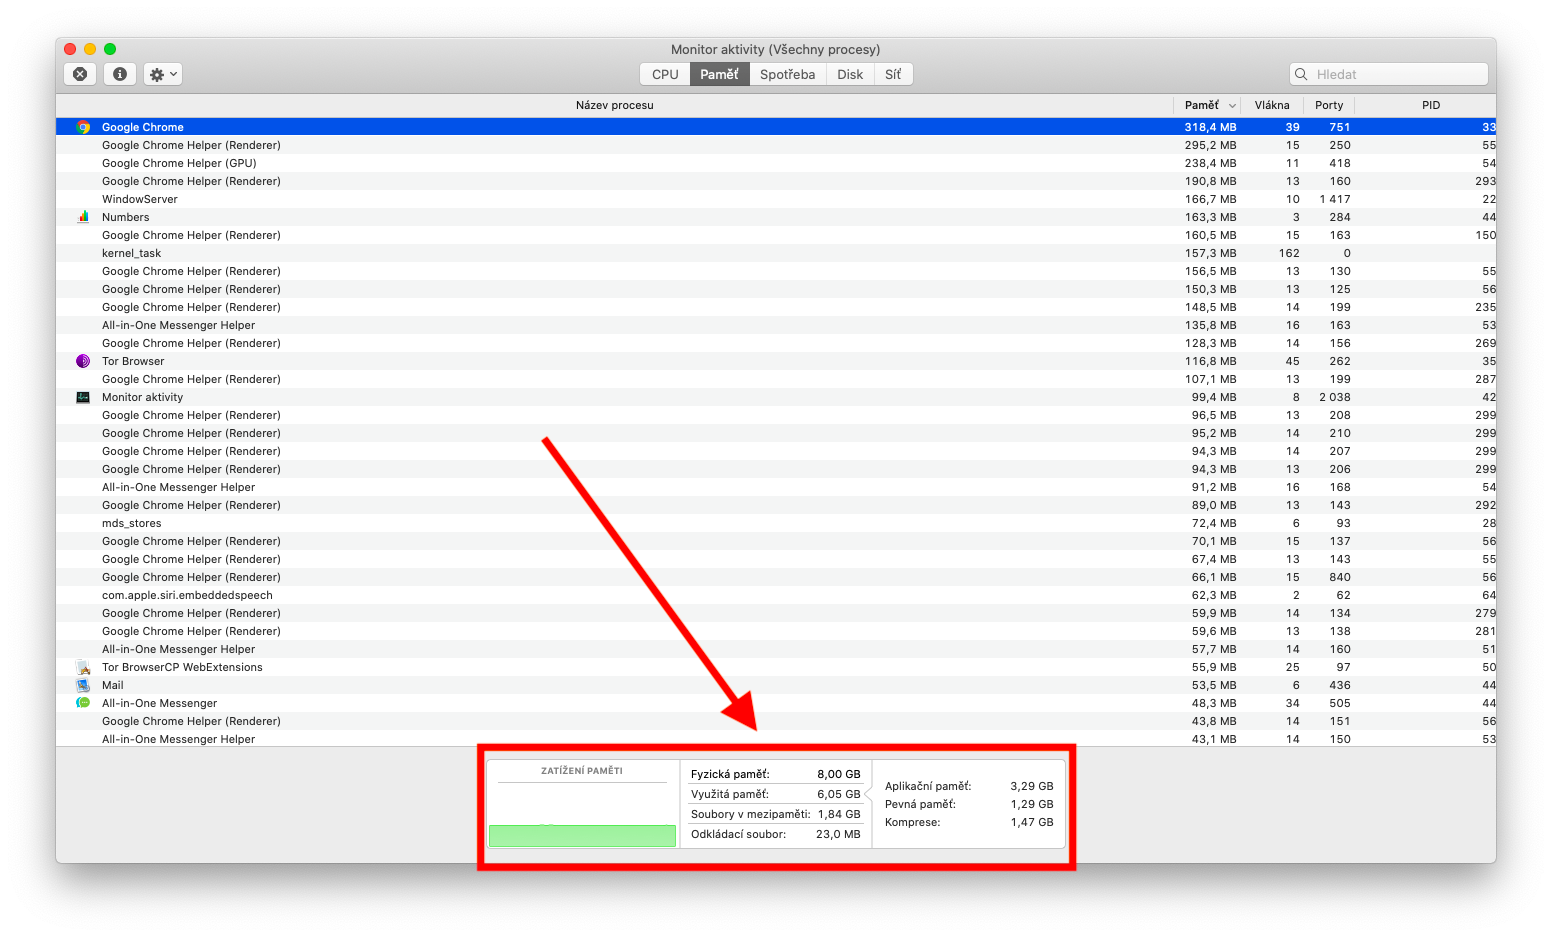
If you have a problem with one of the processes on your Mac, you can easily end it in the Activity Monitor. In the Process Name column, select the process you want to end and click Force End in the upper left corner of the application window. While working with Activity Monitor, you've probably also noticed a panel titled Memory - in this panel you'll find information about the amount of memory your Mac is using, the frequency of memory paging between RAM and the startup disk, the amount of memory provided to an application, and the percentage of compressed memory on this provided memory. At the bottom of the window, you'll find the Memory Usage graph - green indicates efficient use of all available RAM, yellow indicates your Mac may need more RAM later. The red color indicates the need for more RAM.
