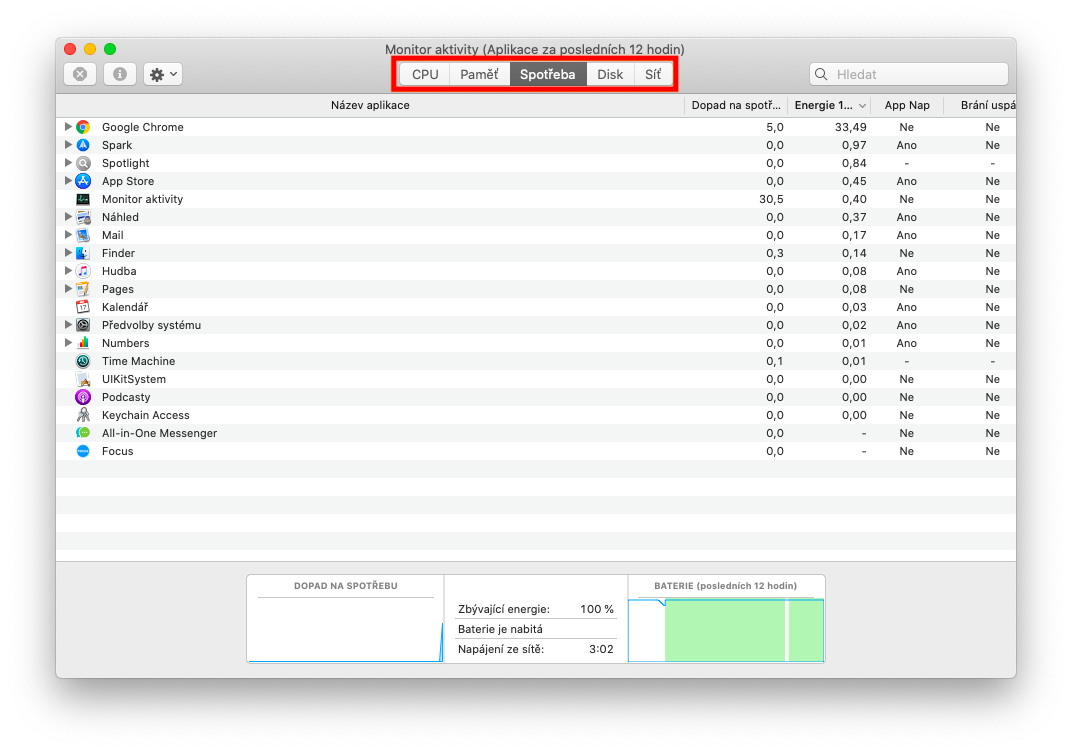
Activity Monitor is a useful tool to help you see what processes on your Mac are using up your CPU, memory, or network. In the following parts of our series on native Apple apps and tools, we'll talk about how to use Activity Monitor to get all the information you need.
It could be interest you
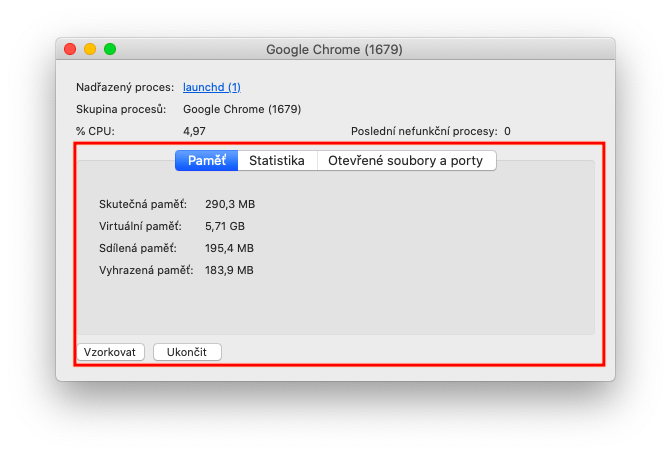
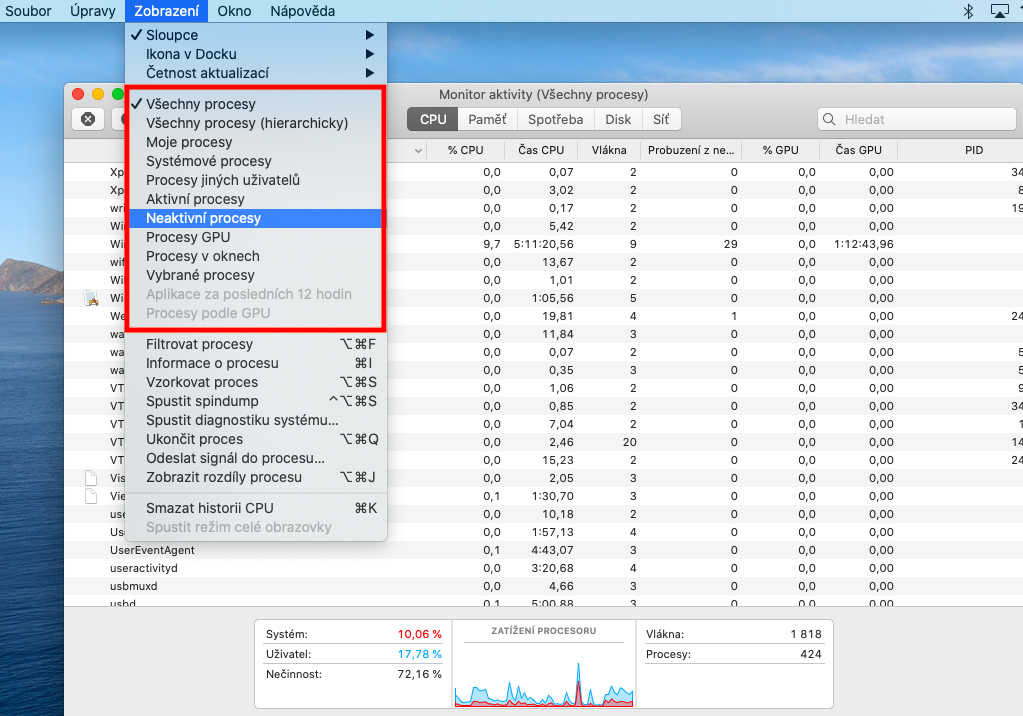
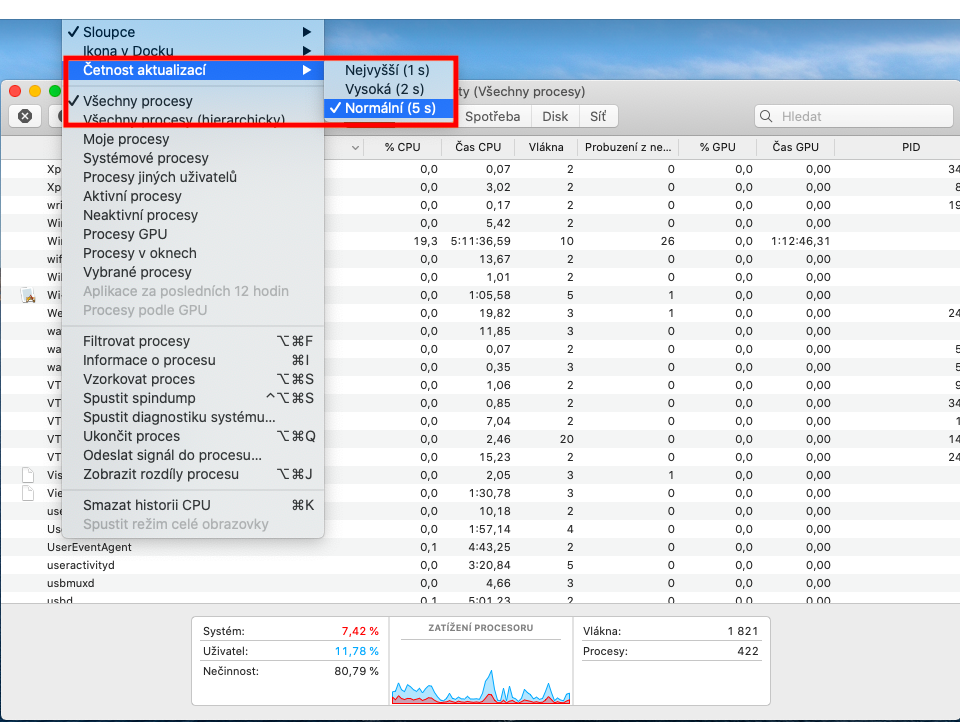
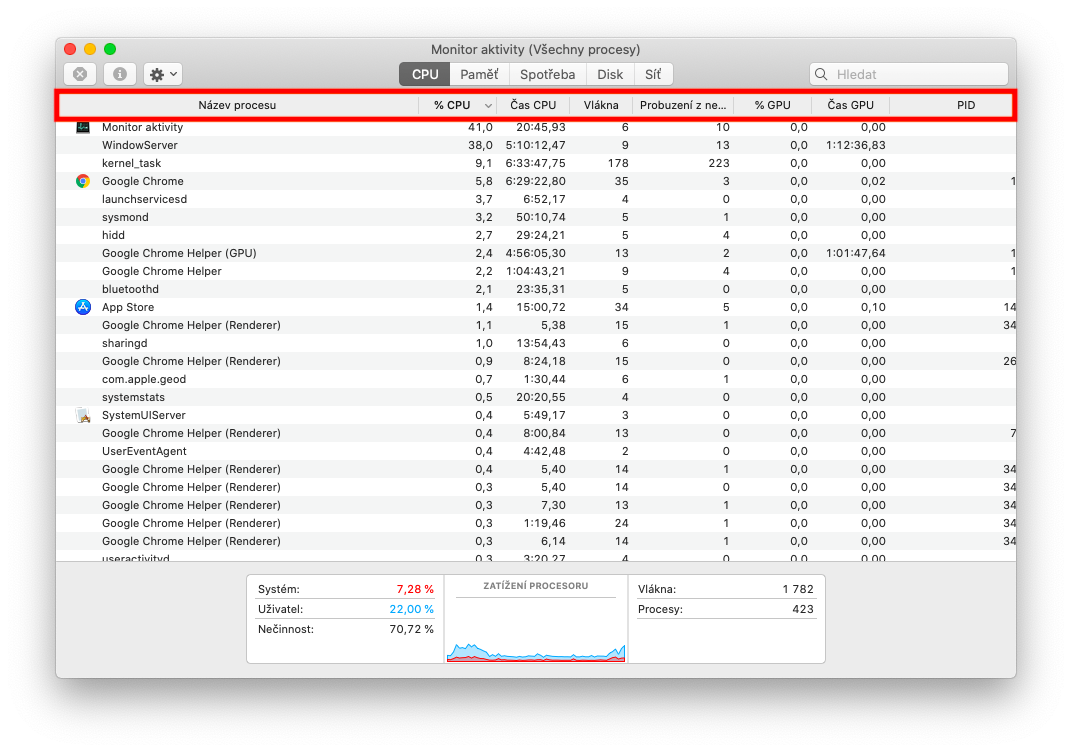
Viewing process activity is a very simple matter in the Activity Monitor. You can start the activity monitor either from Spotlight - that is, by pressing Cmd + space and entering the term "activity monitor" in the search field, or in the Finder in the Applications -> Utilities folder. To view process activity, select the desired process by double-clicking it - a window with the necessary information will appear. By clicking on the header of the column with the names of the processes, you can change the way they are sorted, by clicking on the triangle in the selected header of the column, you will reverse the order of the displayed items. To search for a process, enter its name in the search field in the upper right corner of the application window. If you want to sort the processes in Activity Monitor by specific criteria, click View in the toolbar at the top of your Mac screen and choose the sort method you want. To change the interval at which Activity Monitor updates, click View -> Update Rate in the toolbar at the top of your Mac screen and select a new limit.
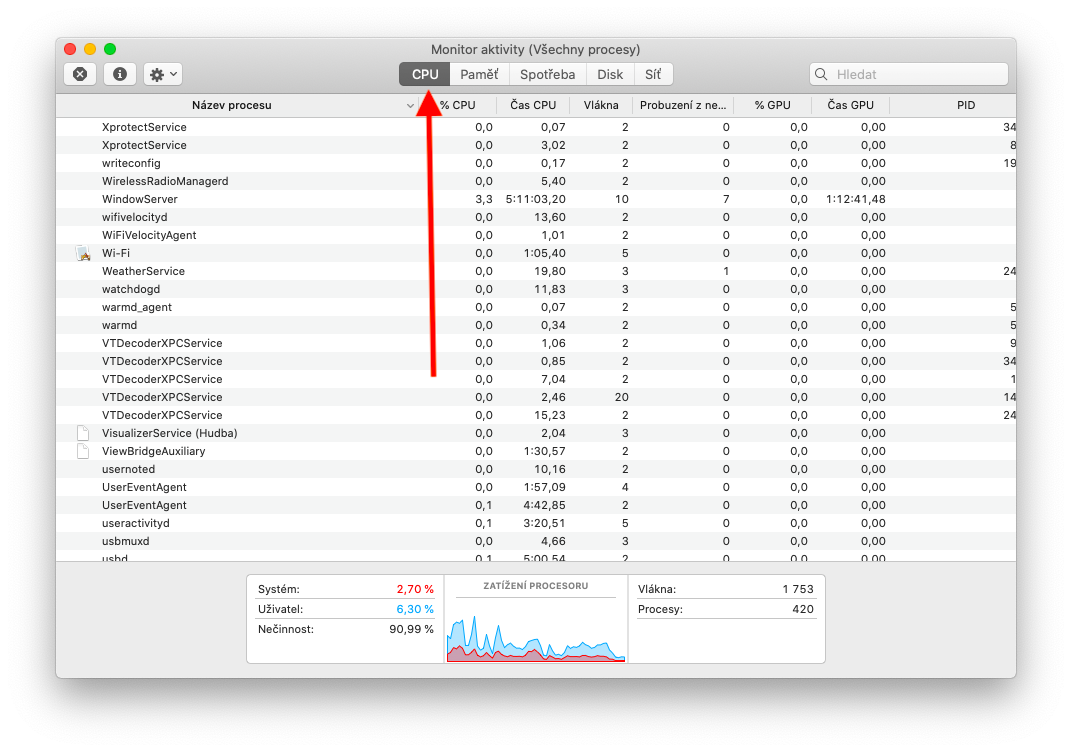
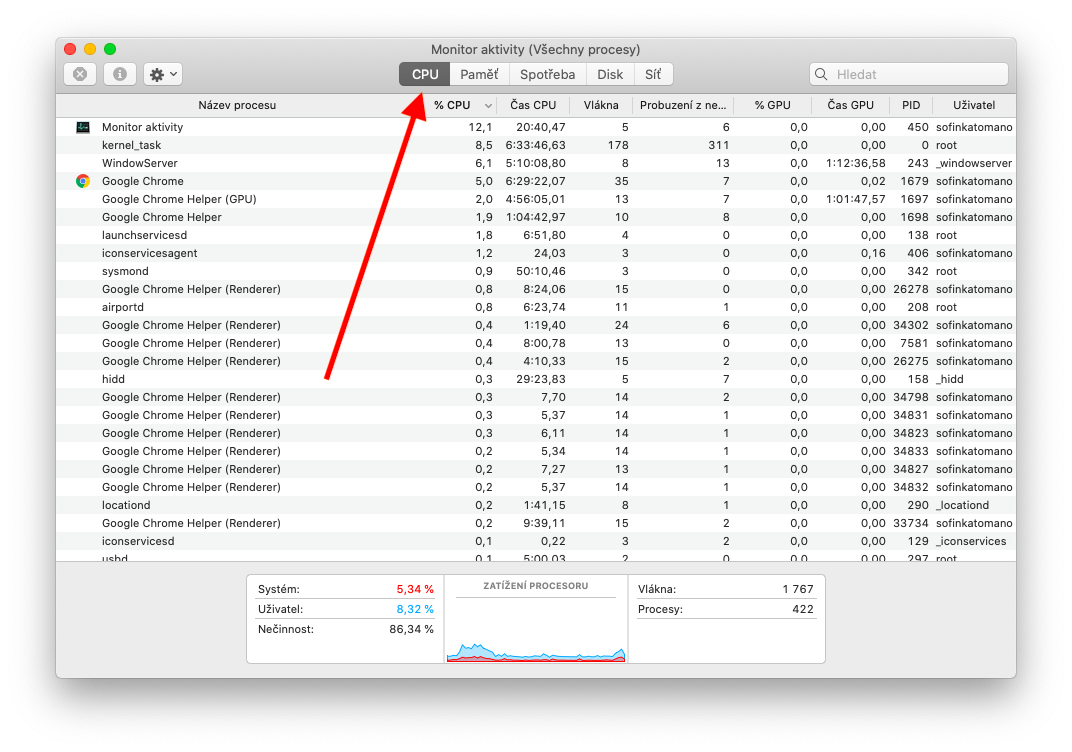
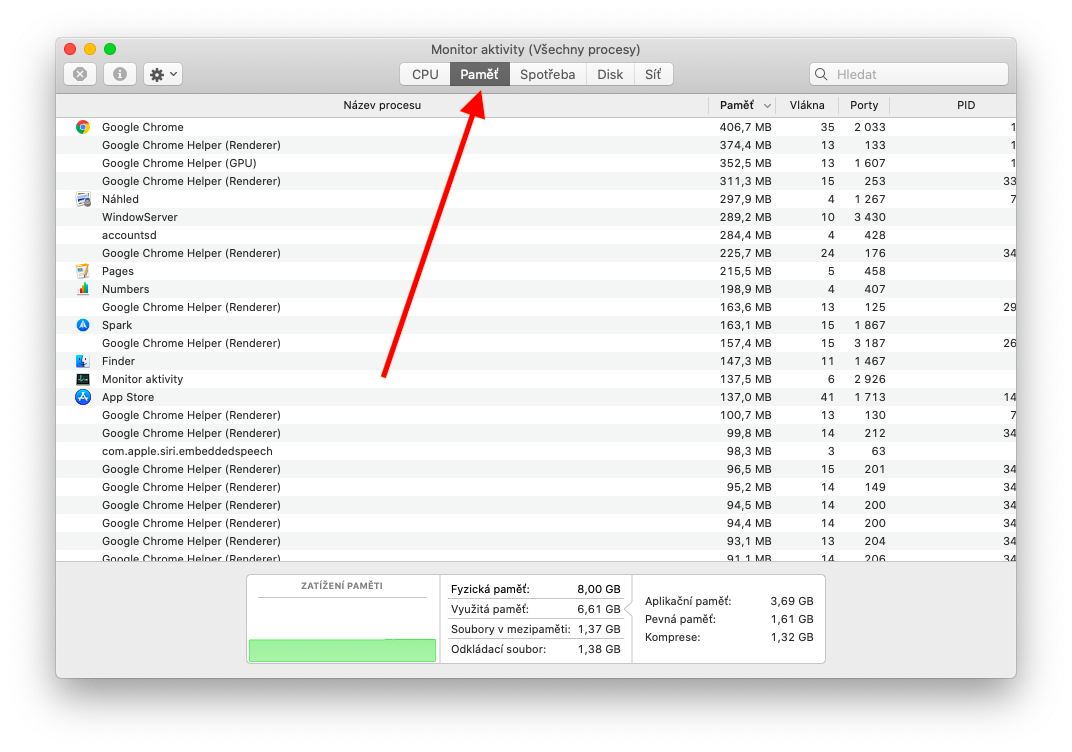
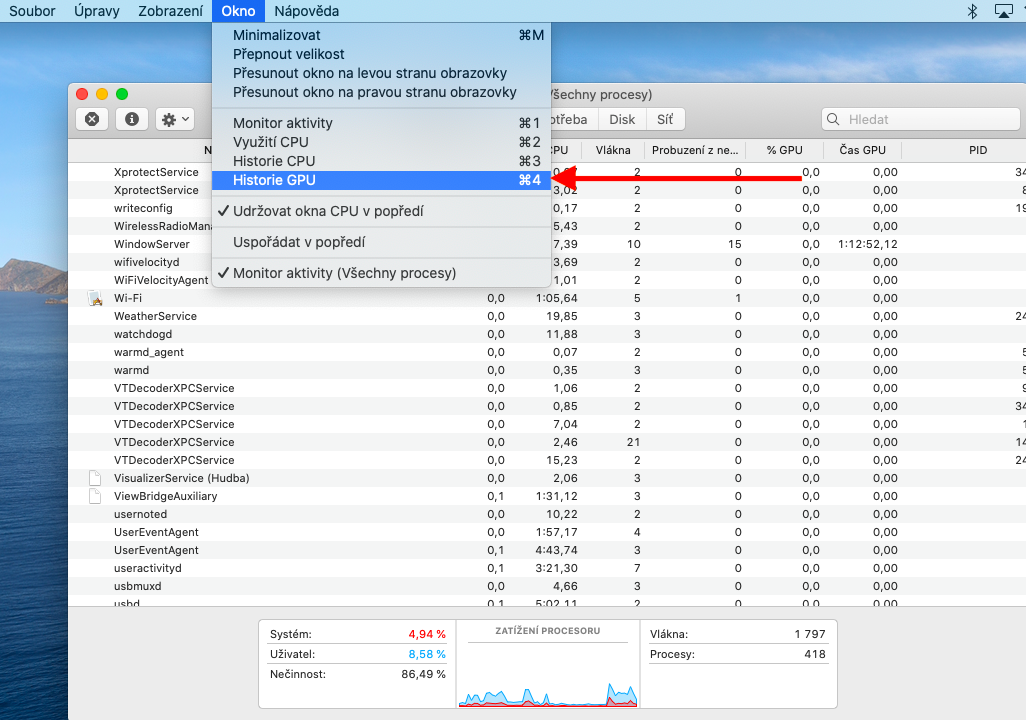
You can also change how and what kind of information is displayed in Activity Monitor on Mac. To view CPU activity over time, click the CPU tab in the bar at the top of the application window. In the bar below the tabs, you'll see columns showing what percentage of CPU capacity is being used by macOS processes, running applications, and related processes, or perhaps an indication of the unused percentage of CPU capacity. To view GPU activity, click Window -> GPU History on the toolbar at the top of your Mac's screen.
