In the final part of the series, dedicated to the native Pages app on the iPad, we'll cover adding charts. Working with charts in Pages on the iPad is a very simple process that even beginners or inexperienced users don't have to worry about.
It could be interest you

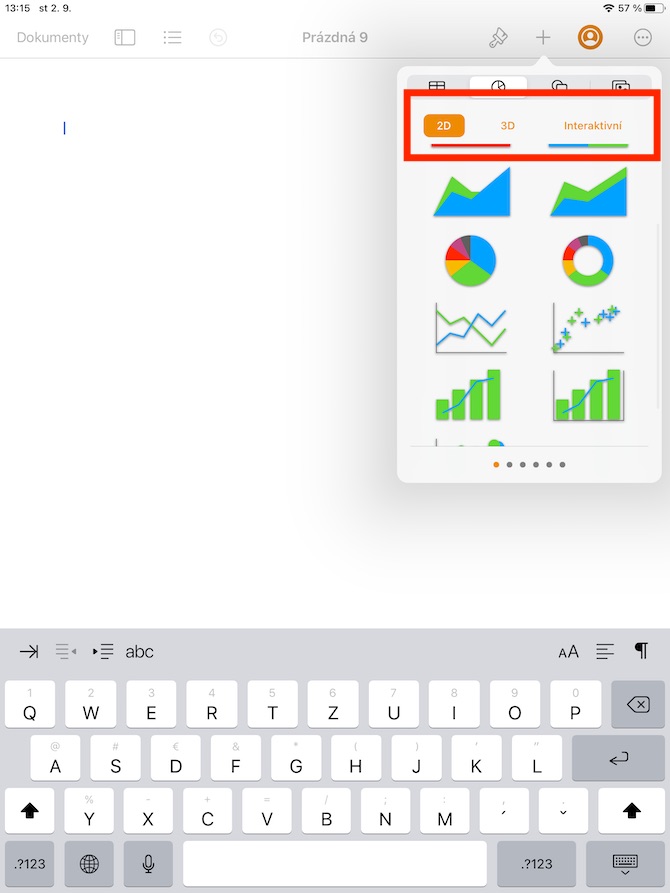
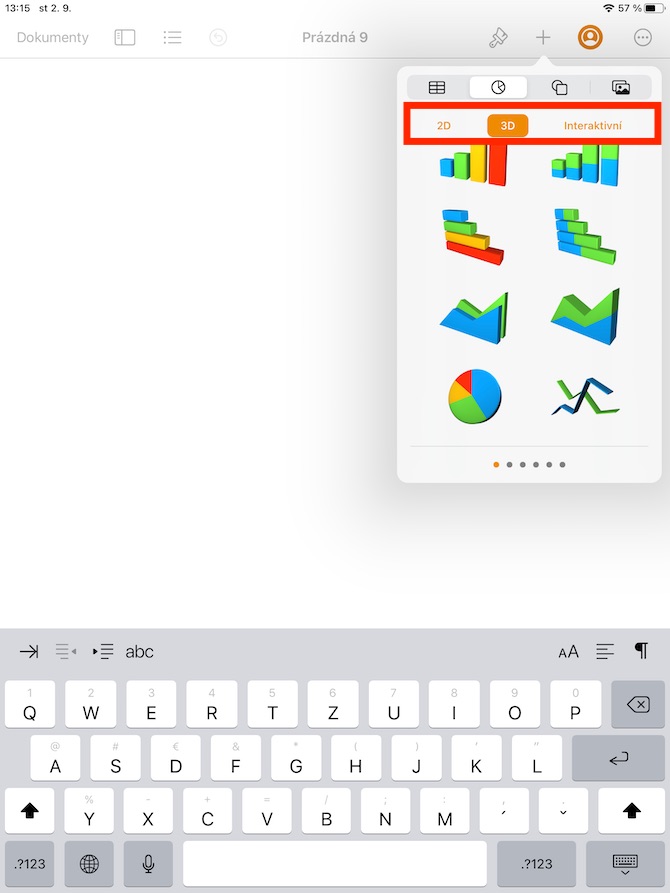
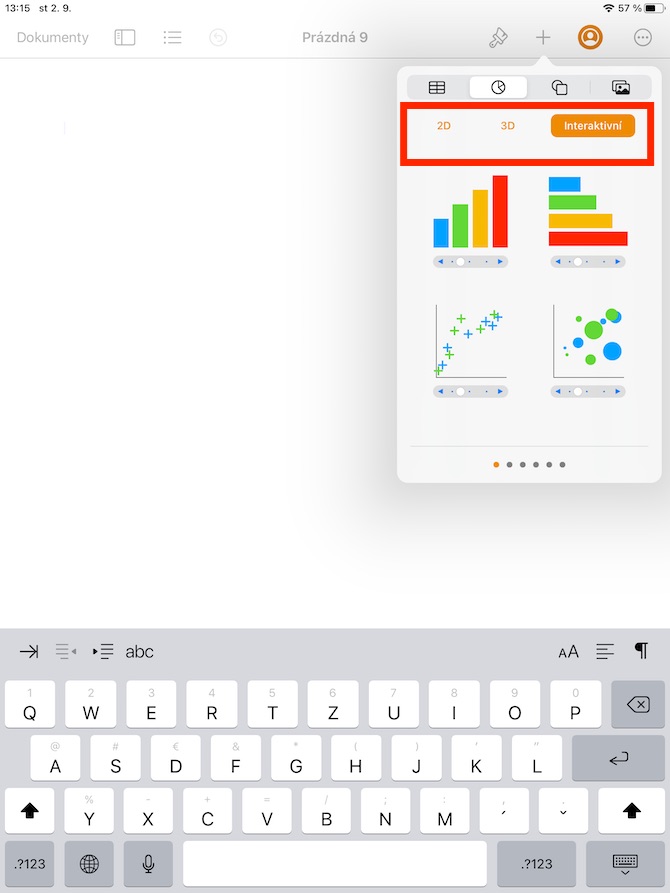
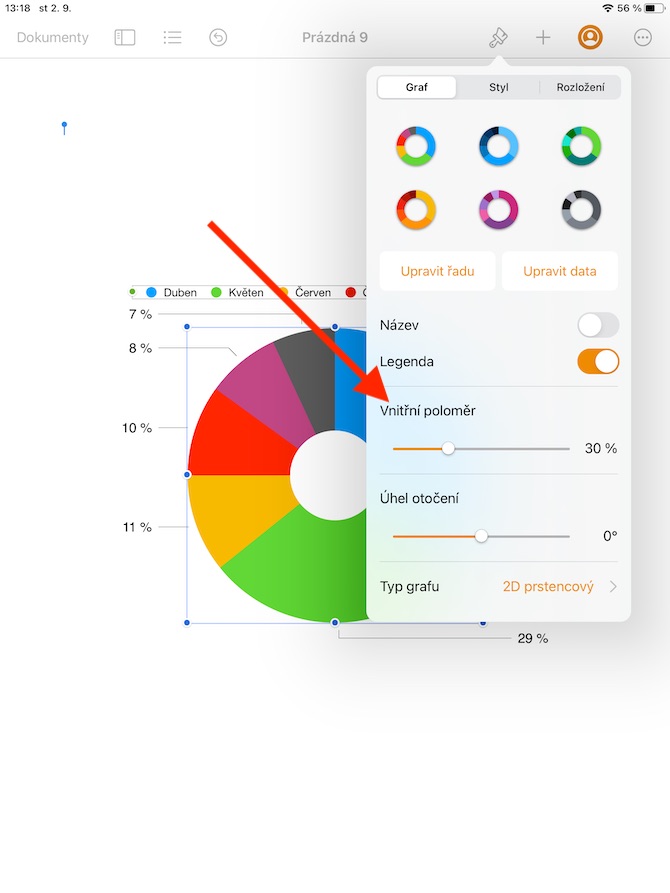
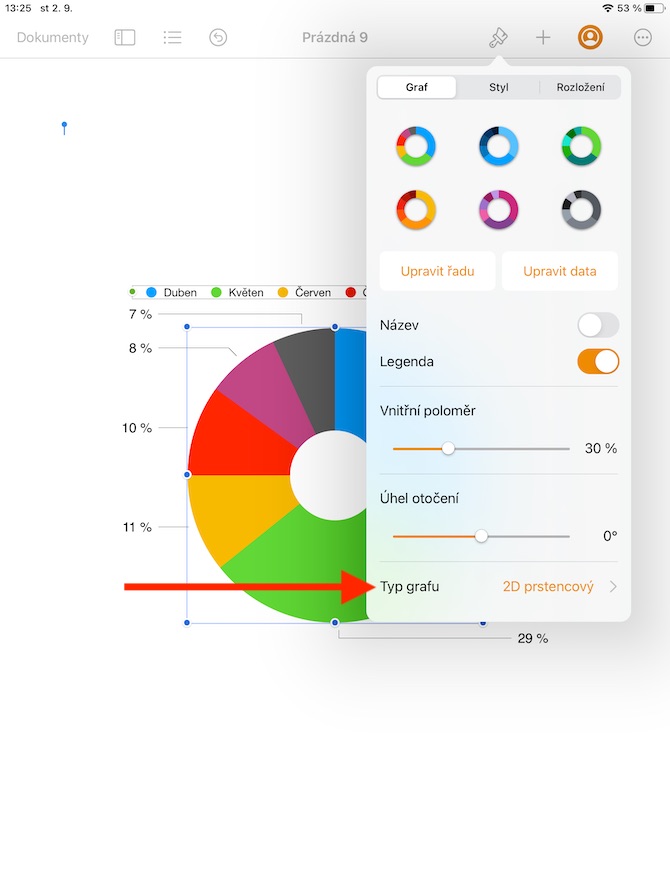
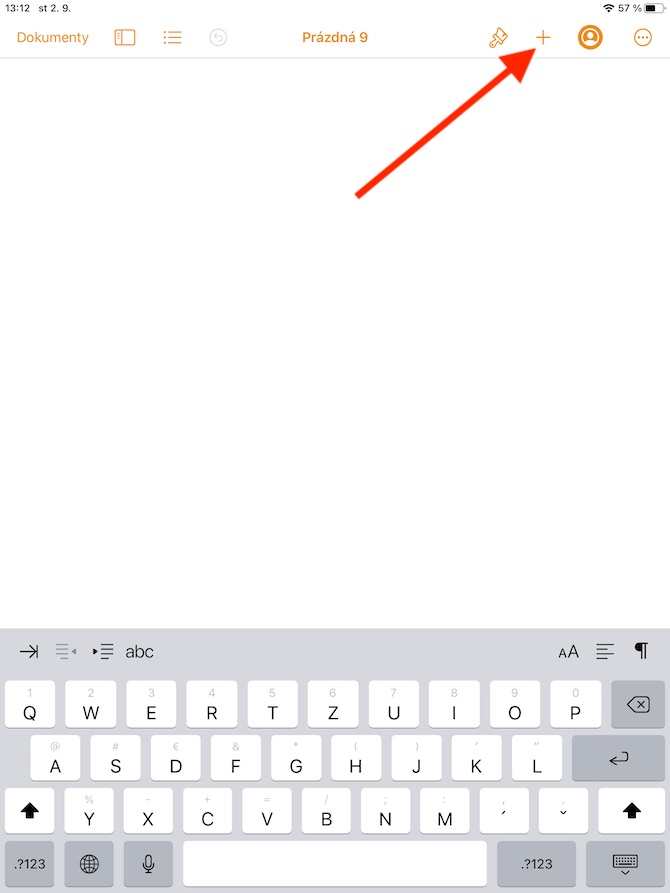
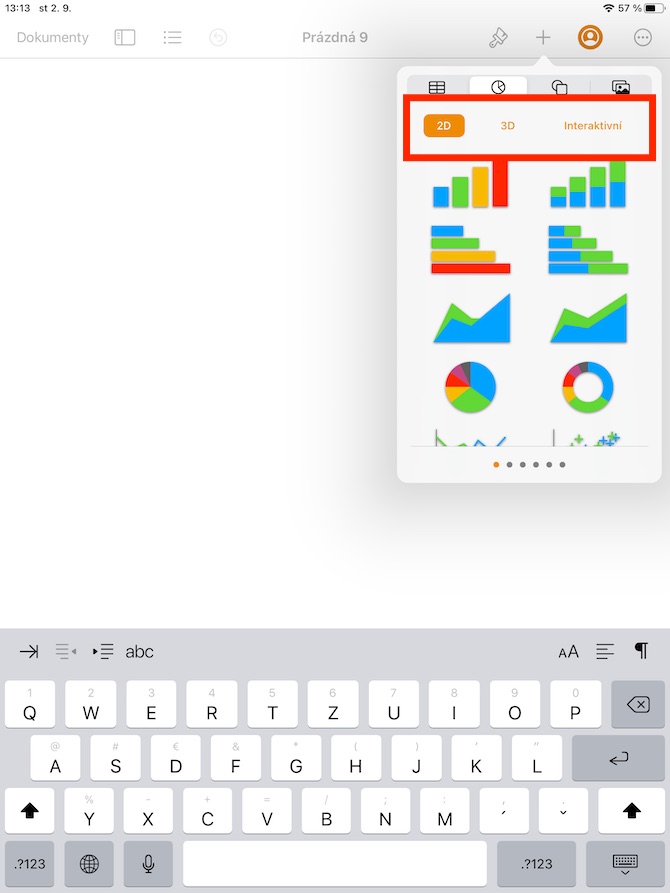
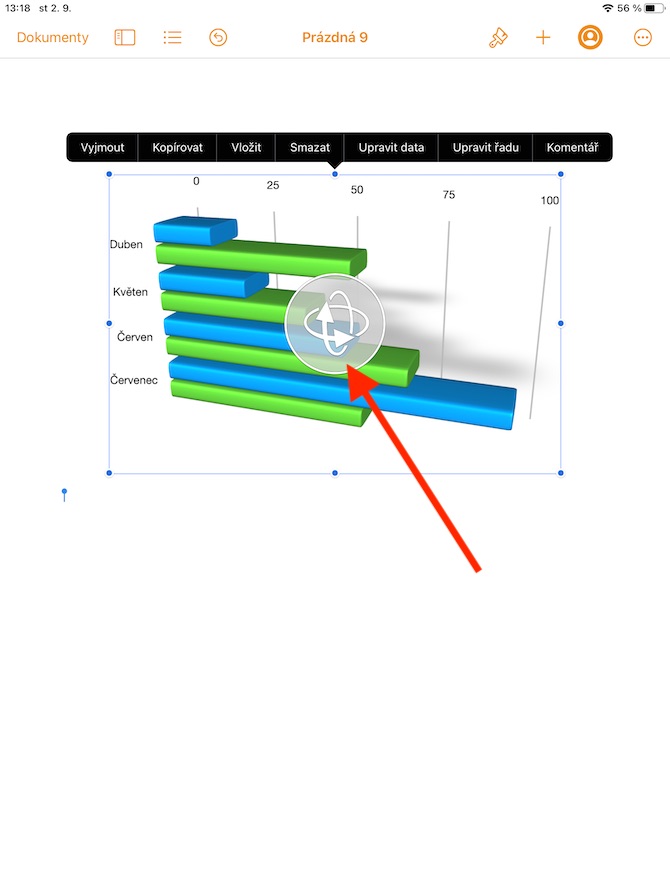
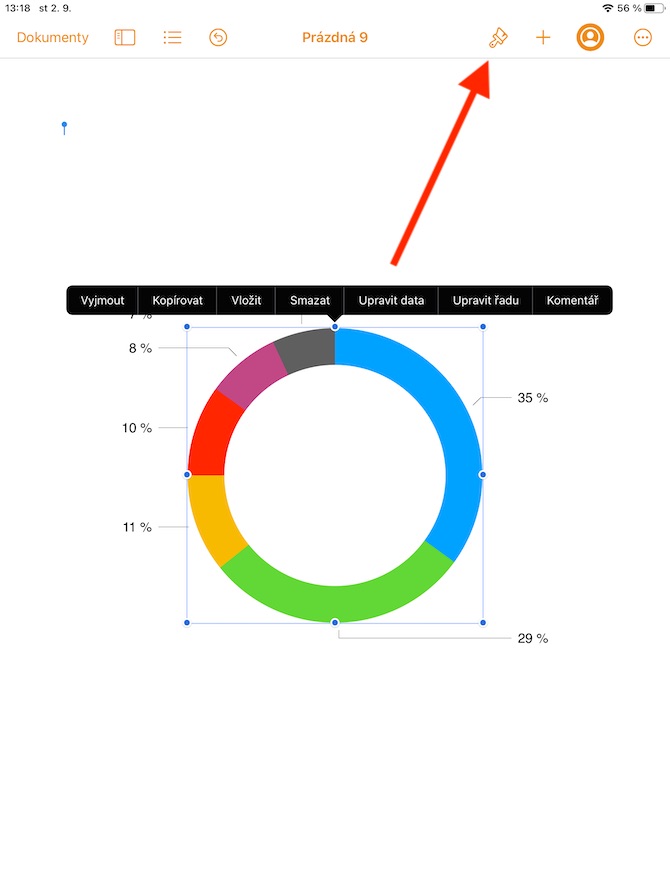
Adding a chart to a document in Pages on iPad is similar to adding a table, shape, or picture. Just tap where you want to add the chart, then tap the “+” symbol at the top of your iPad's display. In the upper part of the menu that appears, click on the tab with the graph symbol (second from the left), and then just select the type of graph you want - you can choose between 2D, 3D and interactive, each of which offers several forms (circular, annular, columnar, etc.). If you insert a 3D graph, you will see an icon in its center, which you can rotate to adjust the orientation of the graph in space. If you've added a ring chart, you can adjust the size of its center hole by tapping the brush icon at the top of your iPad's display and then dragging the Inner Radius slider (see gallery).
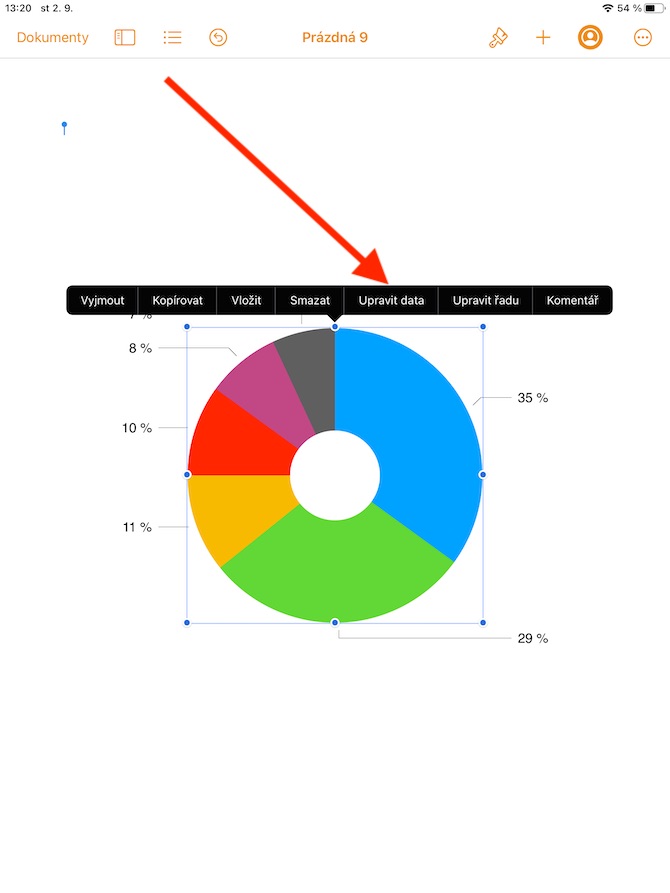
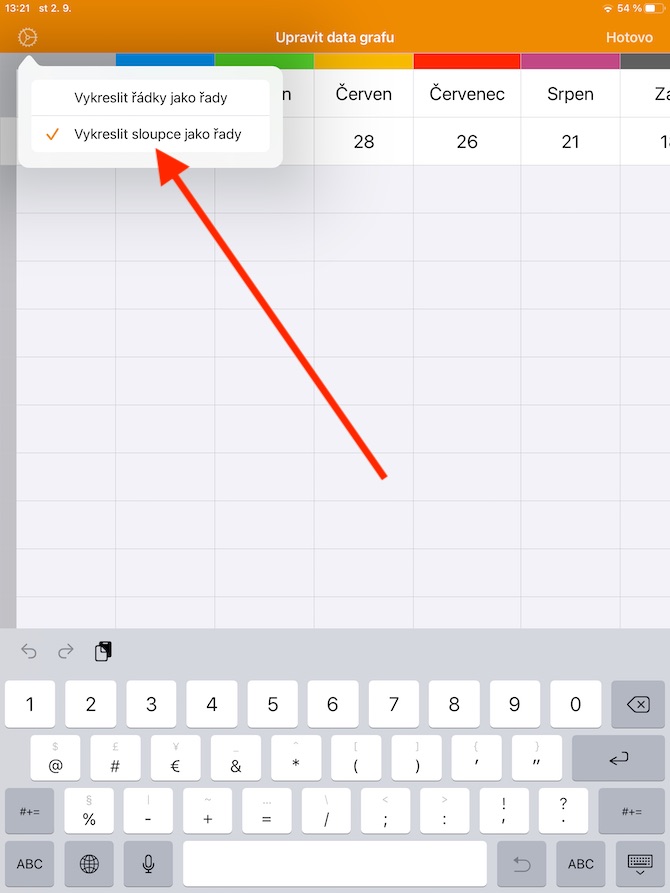
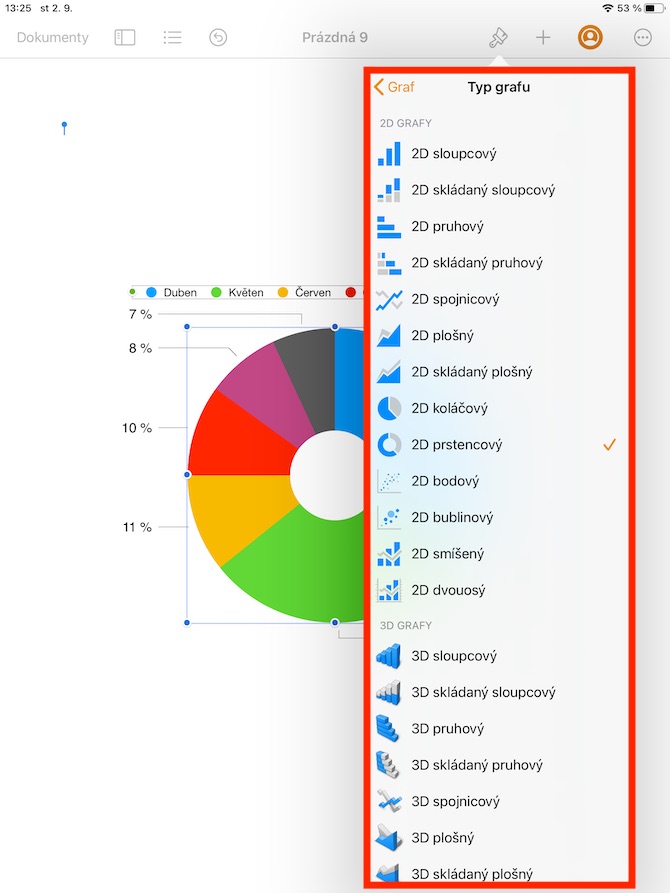
To add data, click on the chart and select Edit data in the menu that appears. Then, depending on the type of chart, you can start working with the data. To set the rendering of rows or columns as data series, click on the gear icon in the upper left corner and select the desired option. When you have completed the necessary adjustments, click Done in the upper right corner. Just as graphs can be removed, copied and pasted in the Pages document on the iPad, you can also delete them - just tap on the selected graph and choose the desired task in the menu that appears. Deleting a chart does not affect the table data, and if you delete the table data on which the chart was created, the chart itself is not deleted; it just deletes all the data in it. If you want to change the type of chart you're working with, just tap to select it and then tap the brush icon at the top of the iPad display. At the bottom of the menu, click Chart Type and then select the desired variant.
