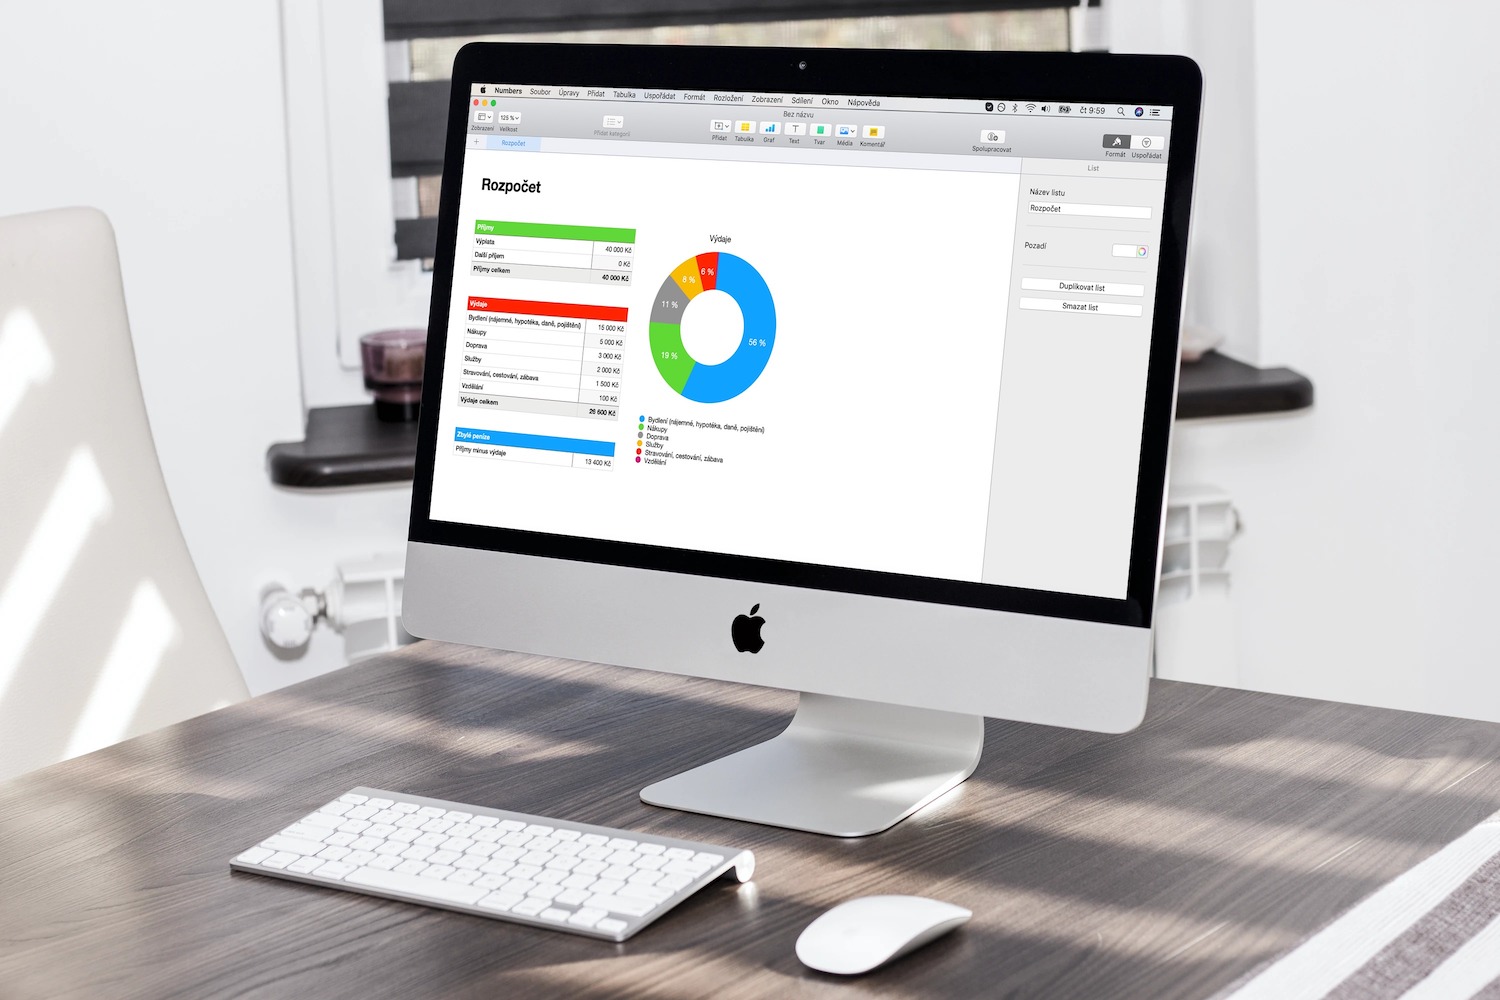
The rich range of features offered by Numbers for Mac includes, among other things, the creation of graphs. This is a rather complex topic that cannot be briefly covered in a single article, therefore in today's part of our series we will focus only on the creation of graphs as such. In the next parts, we will look at adjustments and more advanced work with graphs.
It could be interest you
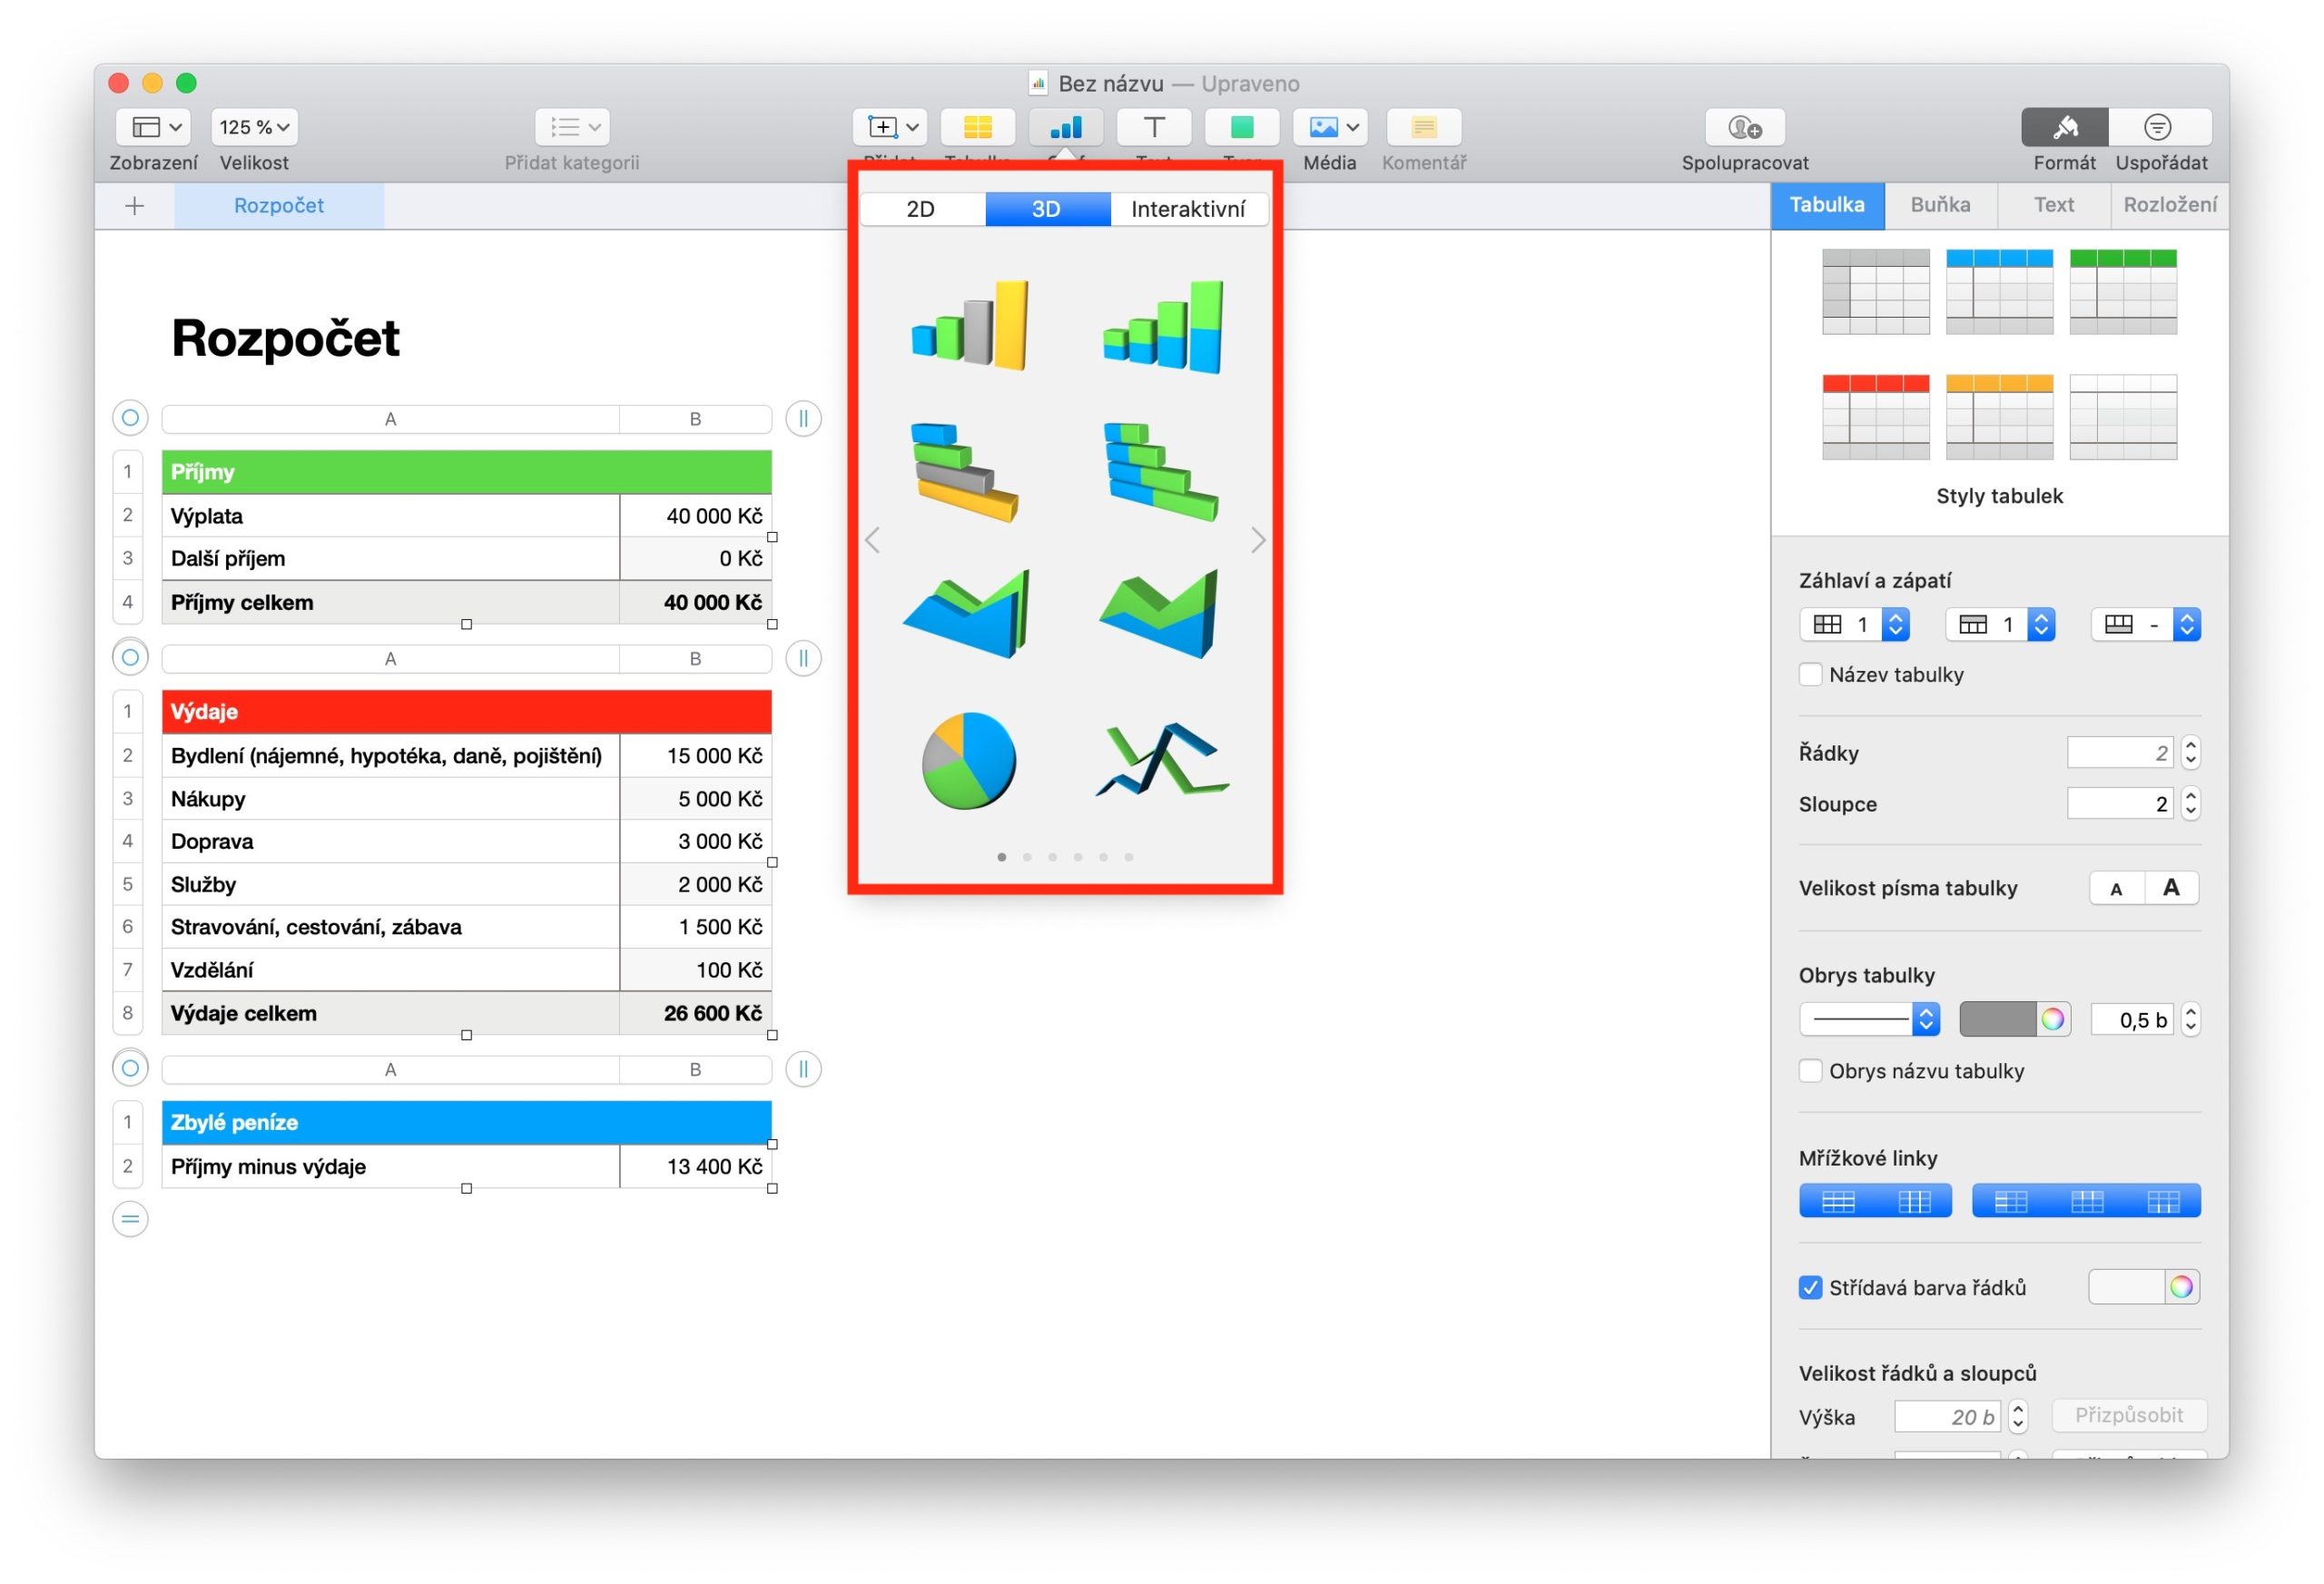
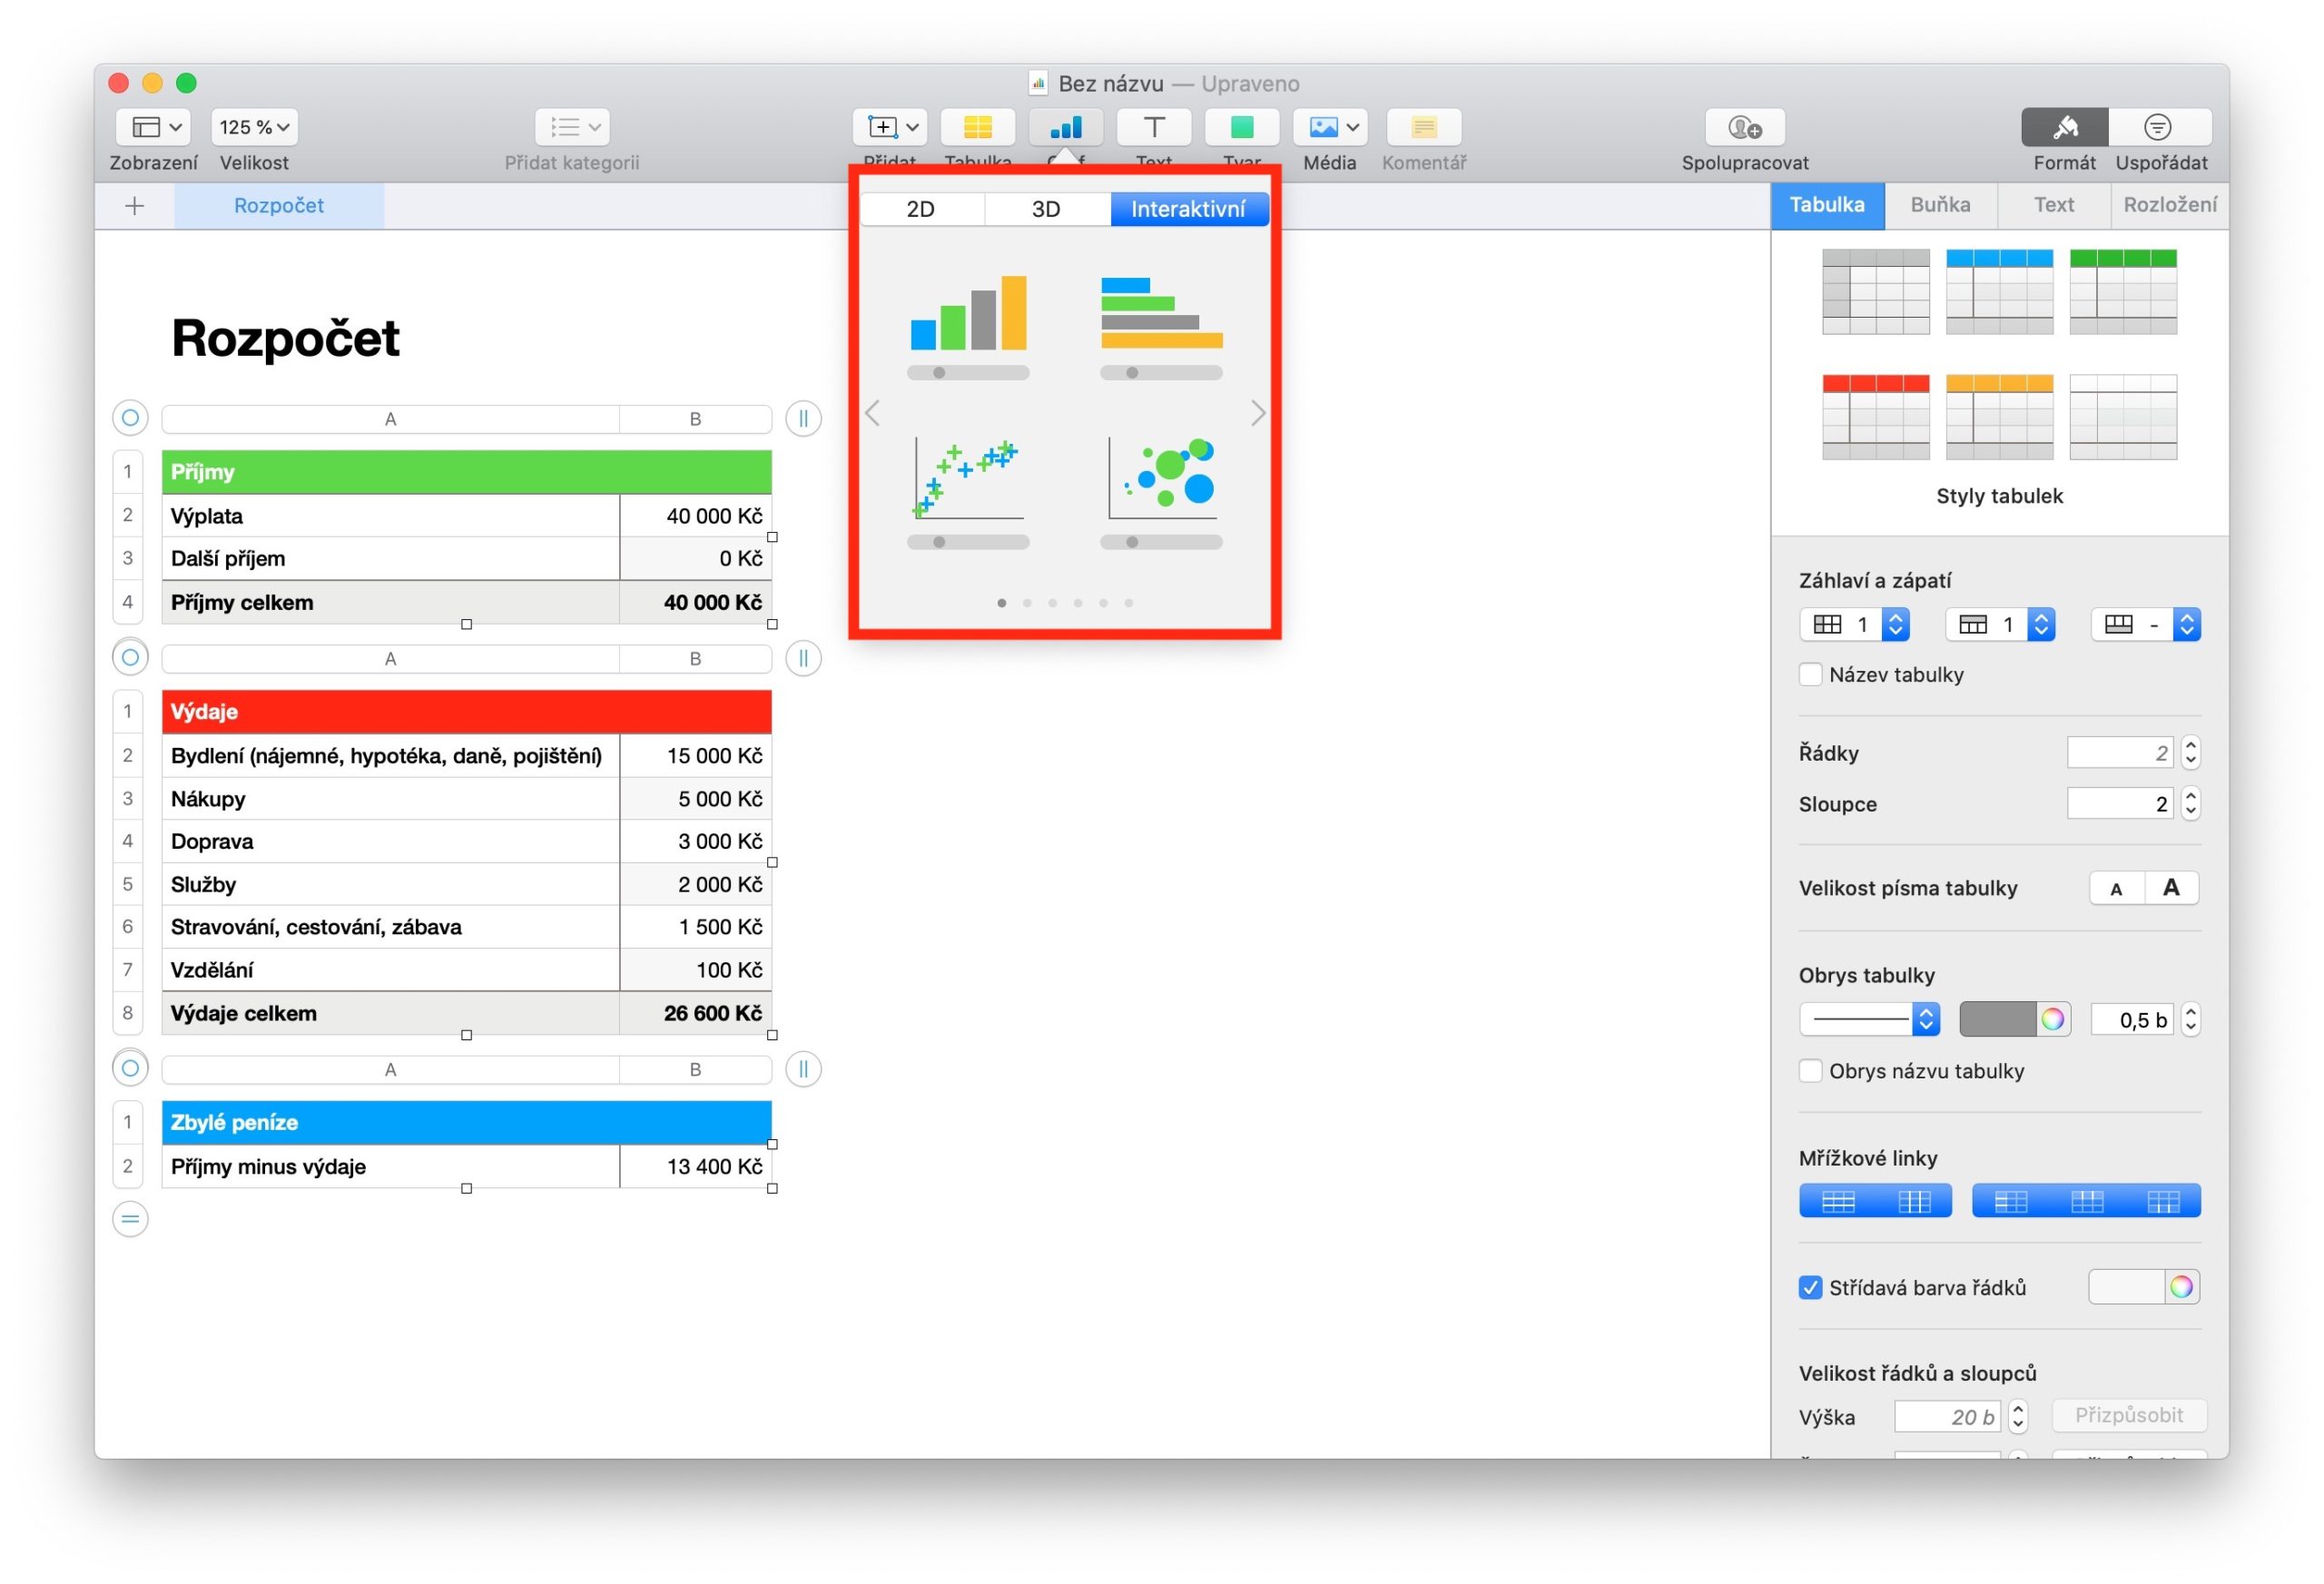
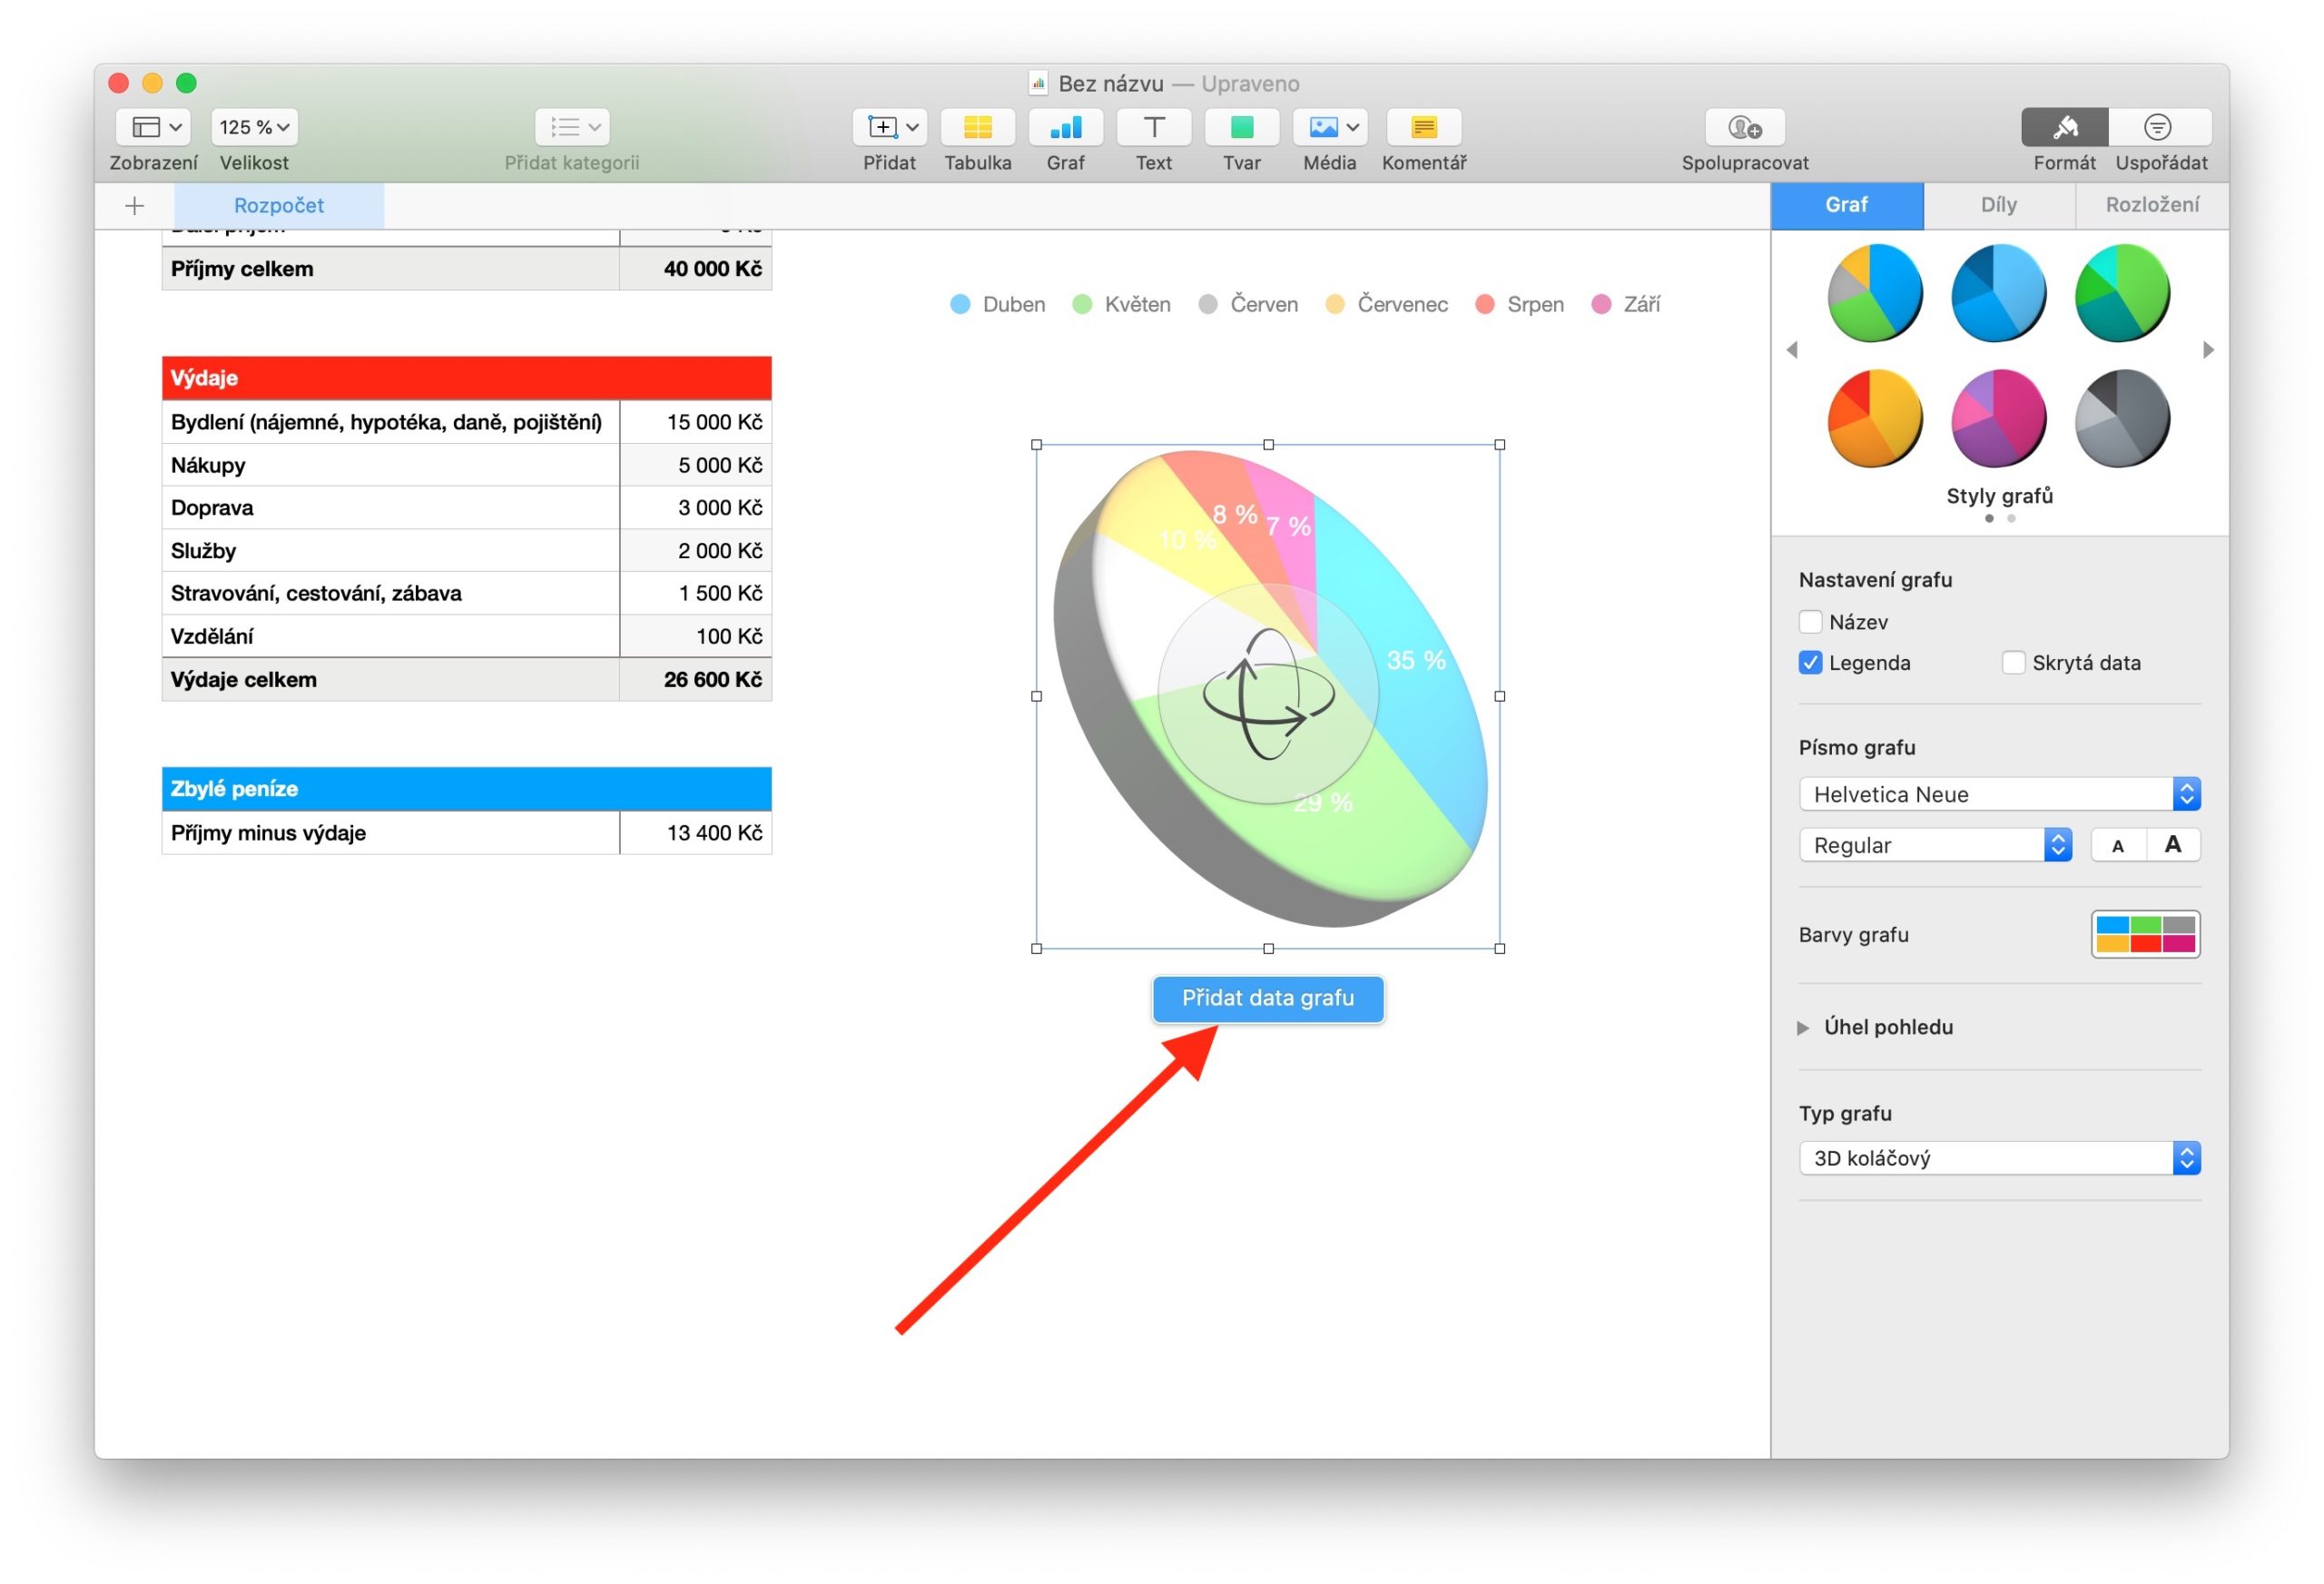
In Numbers on Mac, you can also create a chart using data from a spreadsheet. To create a chart, first select the data you want to work with in the table. After selecting the data, click on the graph icon in the toolbar at the top of the application window and choose 2D, 3D or Interactive among the tabs at the top of the menu. Select the style you want to use and click to confirm your selection. If you choose a three-dimensional graph, an icon for its orientation in space will appear next to it. You can change the orientation of the 3D graph by dragging this icon.
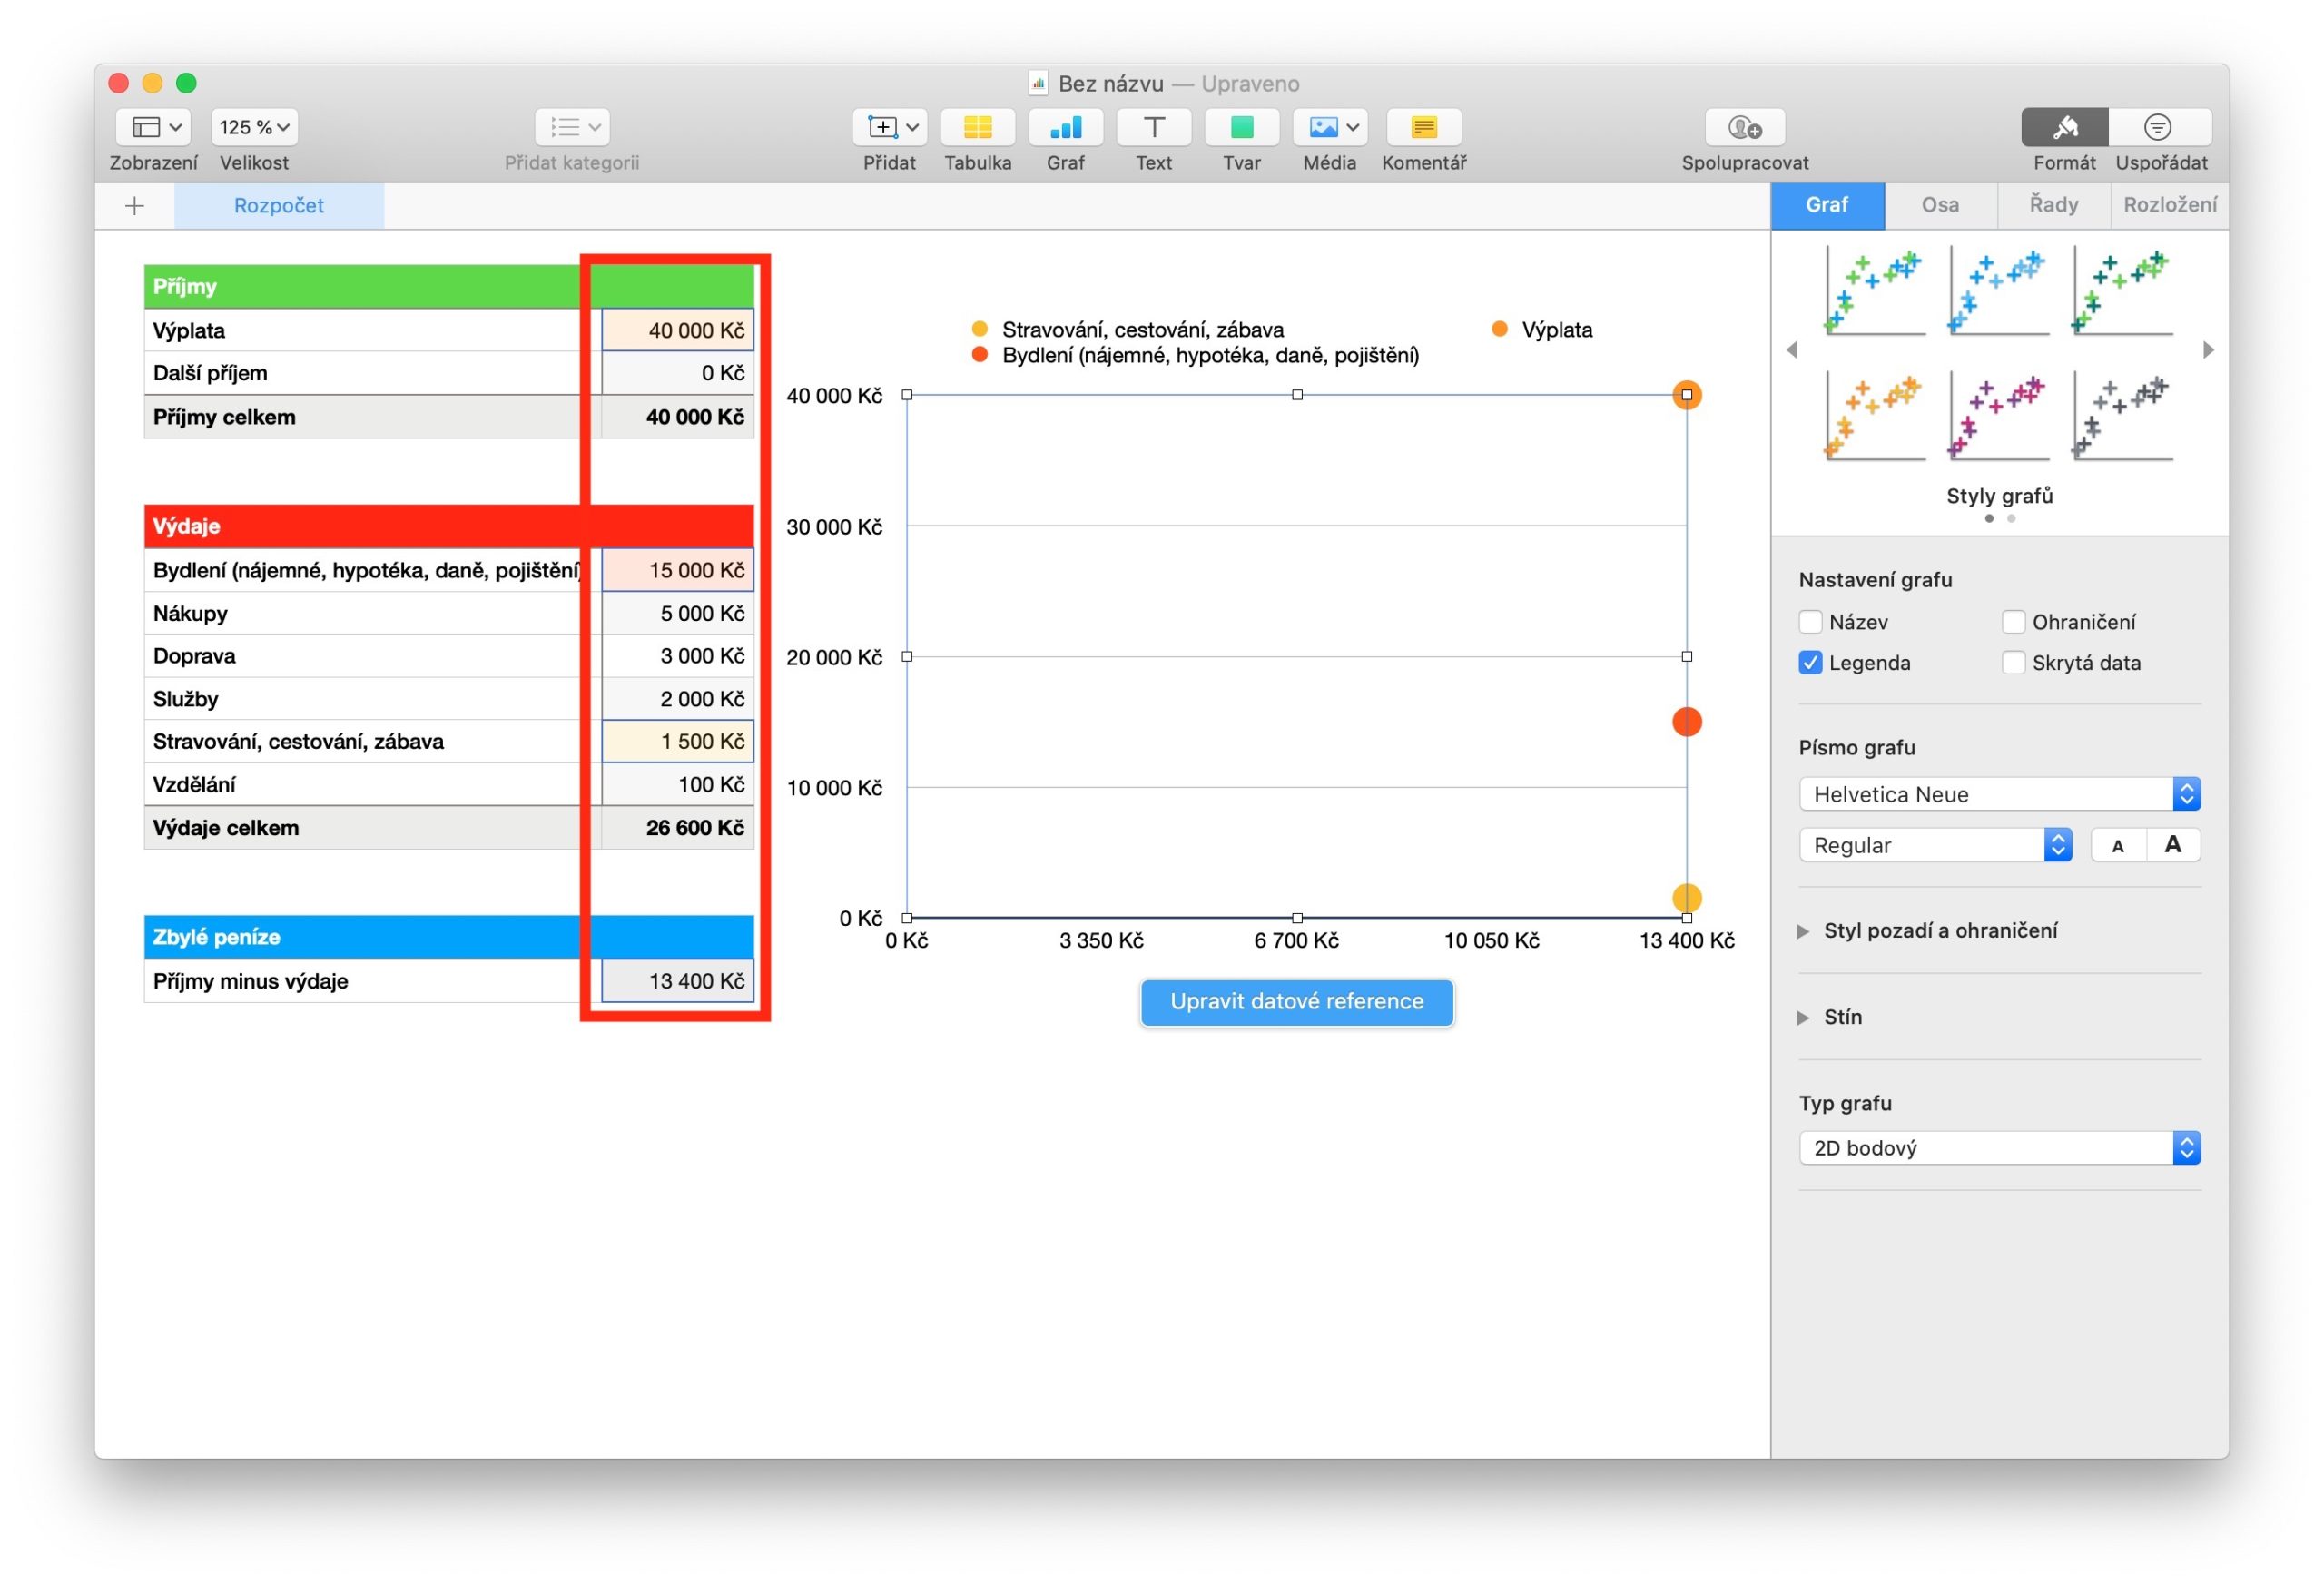
To add more values to the chart, click the Add Chart Values button at the bottom, then click to select the appropriate data in the table. To add a scatter or bubble chart, click the chart icon on the toolbar at the top of the application window. Data in scatter charts are displayed in the form of points, at least two columns or rows of data are required to enter the values of one data series, in in a bubble chart, data is displayed in the form of bubbles of different sizes. Both of these types of charts are created by first clicking on the chart icon on the toolbar at the top of the application window, selecting a point or bubble chart, then clicking the Add chart data button below the chart and selecting the necessary data by clicking in the table.
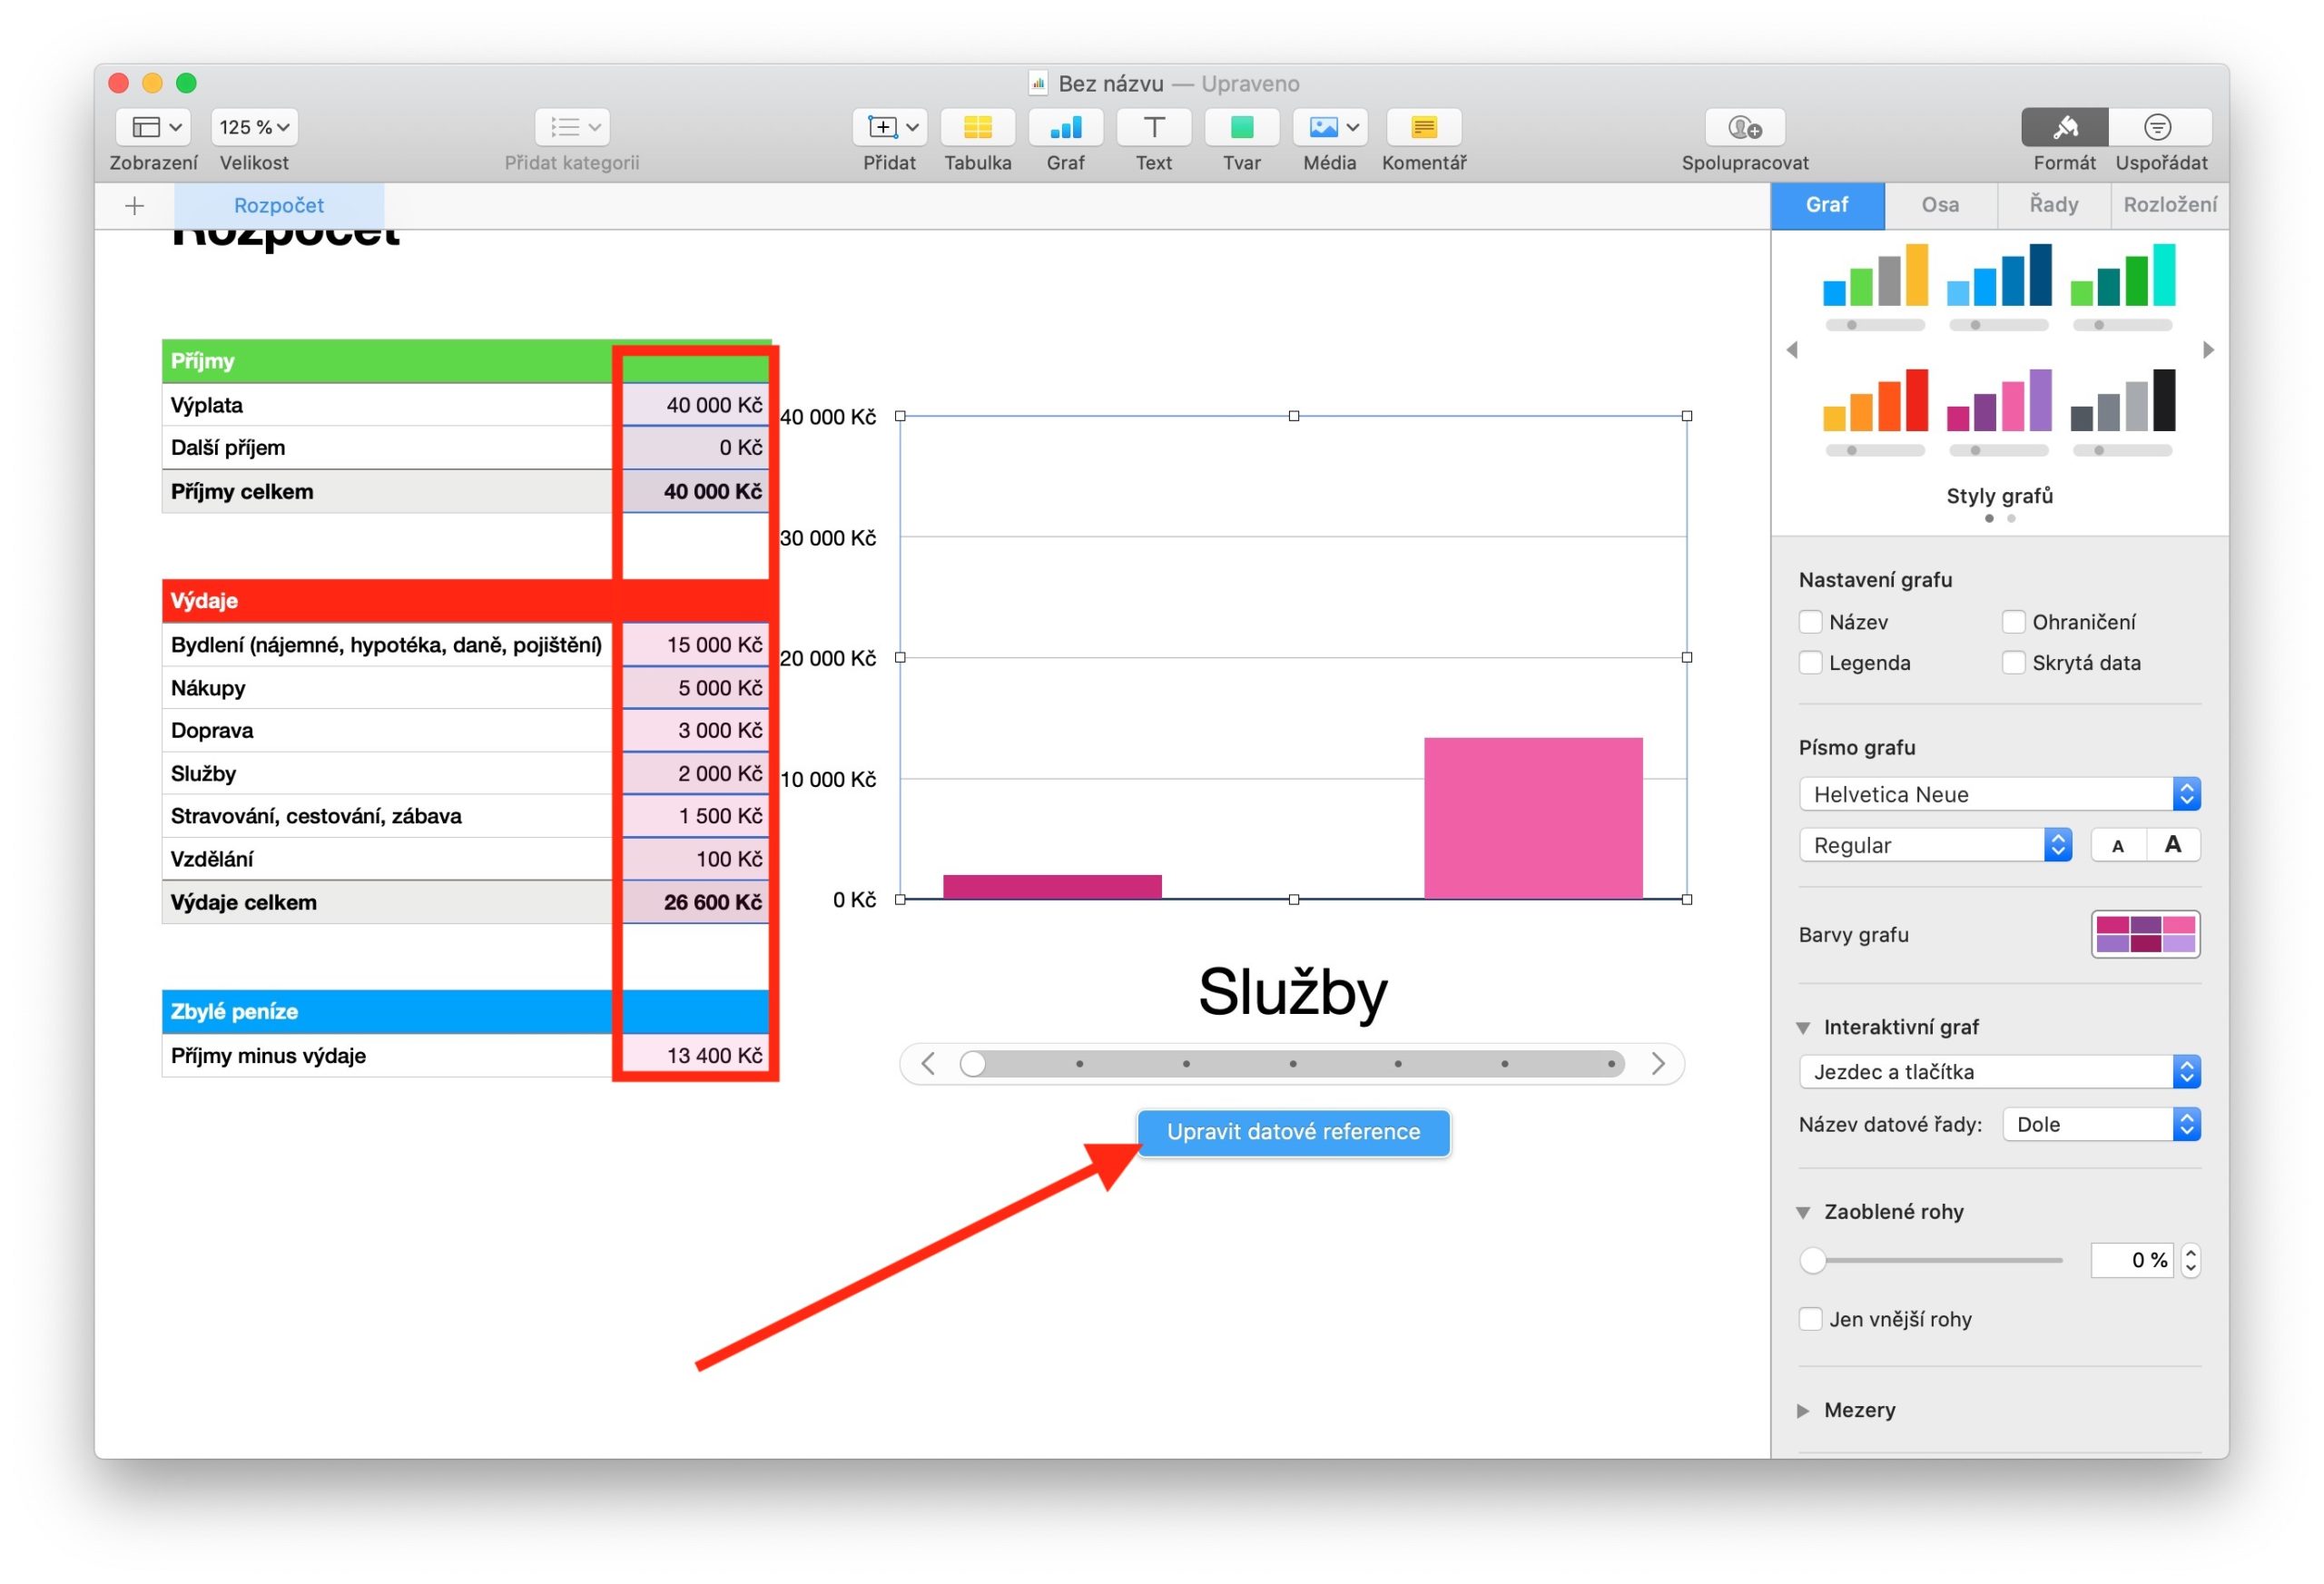
You can also add an interactive chart to your Numbers document that shows data in stages, so you can highlight the relationship between two sets of data. To add an interactive chart, follow the same procedure as for the previous two types of charts. For a chart, if you want to change the type of control used to interact with the chart, click the chart, then select Format at the top of the panel on the right. In the panel, click the Chart tab and choose Buttons Only from the pop-up menu under Interactive Chart.

